Portfolio Rebalance / August 06
Following the Signal Sigma Process
The approach to this article follows the step by step process described here. All visuals are sourced from various instruments available in the platform. If you are using the Portfolio Tracker, you’ll be able to see how we set it up for our own portfolio at the end of this article.
The recent global risk averse mood has led to a sharp and pronounced selloff in all major asset classes with the exception of long term treasuries. The negative shift in correlation between SPY and TLT is good news for portfolios like ours which are holding both types of assets, since they will now tend to hedge each other. This regime is problematic for the broader economic outlook, however, as fears of persistent inflation recede.
It is not that inflation is receding that’s the problem - it’s why inflation is receding that’s got investors worried. The focus is now on whether the economy will achieve a soft landing or not. Is the Fed behind the curve? Interest rate traders certainly think so, with 3 rate cuts again on the table for 2024.
The market is now experiencing a “perfect storm” consisting of fundamentally minded economic growth concerns, as well as the technical supply-demand issue of the yen carry trade - which is not yet fully unwound. For investors, it’s important ultimately to assess the former (fundamentals) and ignore the latter (supply-demand).
The vast U.S. services sector that accounts for the majority of economic activity rebounded in July after a short contraction as the second quarter ended. Accompanying measures of new orders for services businesses and employment in the sector were also both on the positive side - we see no immediate danger of a recession from this series.
U.S. gross domestic product growth exceeded most estimates of the economy's potential in the second quarter at 2.8%; while that can oscillate from quarter to quarter and backward-looking in nature - the first quarter rate was half that.
Fed Chair Jerome Powell focuses on final sales to private domestic purchasers as a better indicator of underlying demand. That remained steady at 2.6%, a level consistent with ongoing growth.
Investors’ most pressing recession signals are the Sahm Rule and the un-inversion of the yield curve, both of which have very good track records of predicting downturns in the economy.
Developed by former Federal Reserve economist Claudia Sahm, the Sahm Rule in the past has shown a recession is already underway when the three-month moving average of the national unemployment rate rises 0.50 percentage point above its low from the previous 12 months; that level was breached when July's unemployment rate rose to 4.3%, though Sahm herself has questioned whether the rule should apply in the current circumstances because of labor market distortions caused by the COVID-19 pandemic and recovery;
The 2/10 yield curve did not exactly un-invert and is now close to levels last seen in October 2023. As mentioned before, this indicator has a near-perfect track record for predicting recessions, similar to the Sahm Rule.
In conclusion, there are valid reasons for being concerned about the market’s direction in the near term. In this article, we’ll explore the optimal positioning, along with moves every investor can undertake in his portfolio to navigate the current market.
Asset Class Allocation
The first step in determining optimal portfolio positioning is taking a look at the performance of the main asset classes, and determining which are suitable for investment. The Asset Class Overview Instrument gives us a clear macro picture.
Equities and Commodities got hammered in the past week, with Gold suffering some losses as well. Treasuries have achieved a breakout and are now highly overbought.
For today’s technical analysis exercise, we’ll consider our alternate “slower but still-positive growth” scenario, with a Price Target of $540 and a 10% CAGR slope for the trading channel. Adjusting SPY’s chart with these parameters yields a view where the risk/reward appears neutral at around $496, where we expect technical support to come in (S1 and 200-DMA).
Real downside and the level that would justify a more heavy handed Fed intervention (a.k.a. the “Fed Put”) resides much lower in our opinion, closer to $453. If that level should be reached, investors would be looking at a -19% pullback from ATH, close to it being regarded as a traditional “bear market”. Critically, a drawdown of that magnitude, should it manifest, would not deter the overarching bullish theme longer term.
Commodities (DBC) have broken below key support at $22.5. The broader complex (which includes copper, aluminum, agricultural commodities and natural gas) is suffering as a consequence of reduced implied demand in a recession scenario. Oil is the sole commodity still in a bull market, as it is a direct beneficiary of Middle East tensions.
We will exit our commodity positions at today’s close.
Gold’s (GLD) ascent continues despite recent wobbles. There’s been some chatter about bullion’s forced liquidation in relation to the yen carry trade issue, but overall, the asset class is well positioned for continued upside.
TLT has achieved a nice breakout, as a flight to safety trade took place when other asset classes plummeted. The guaranteed (and still relatively high) yield that treasuries provide are attractive for investors looking to rotate out of stocks. We have long been proponents that bonds (especially at the long end) offer the best risk-reward proposition for investors currently. Now, this trade is starting to come to fruition.
TLT is highly overbought in the near term, however. As some of the violent movement in the stock market retraces, we expect to see a slight dip in treasuries as well, making for a better entry point.
Enterprise, our core investment strategy, has shifted into defensive mode. While 45% equity exposure is not particularly risk-averse in relation to its 60-40 benchmark, holding 36% in cash will help hedge any volatility going forward.
Stocks exposure via SPY is lowered from 70% previously to 45% today.
Bonds exposure (IEF) is lowered from 25% previously to 15% today, on a profit-taking rationale.
The position in GLD is increased to 5%, taking over the hedging role of commodities as well.
The position in DBC is closed. Commodities are not investible.
Cash is elevated at just over one-third of the value of its portfolio.
Since this model only trades 4 ETFs, we use it to judge overall portfolio positioning. The strategy’s risk profile is now “defensive”. This occurs whenever increased volatility is detected in the market and excessive risk-taking is deemed unwise.
2. Sector / Industry Selection
The next step in creating our portfolio positioning is to break down each broad asset class into more granular groups of assets. This will help us understand which pocket of the market is outperforming or underperforming and make our selection accordingly.
Since Equities are an investible asset class, we’ll take a look at how different Factors are performing and check for any notable opportunities.


We have included tables for this week and the prior 3 article editions in order to help you compare developments (click on the arrows or thumbnails to cycle through the tables).
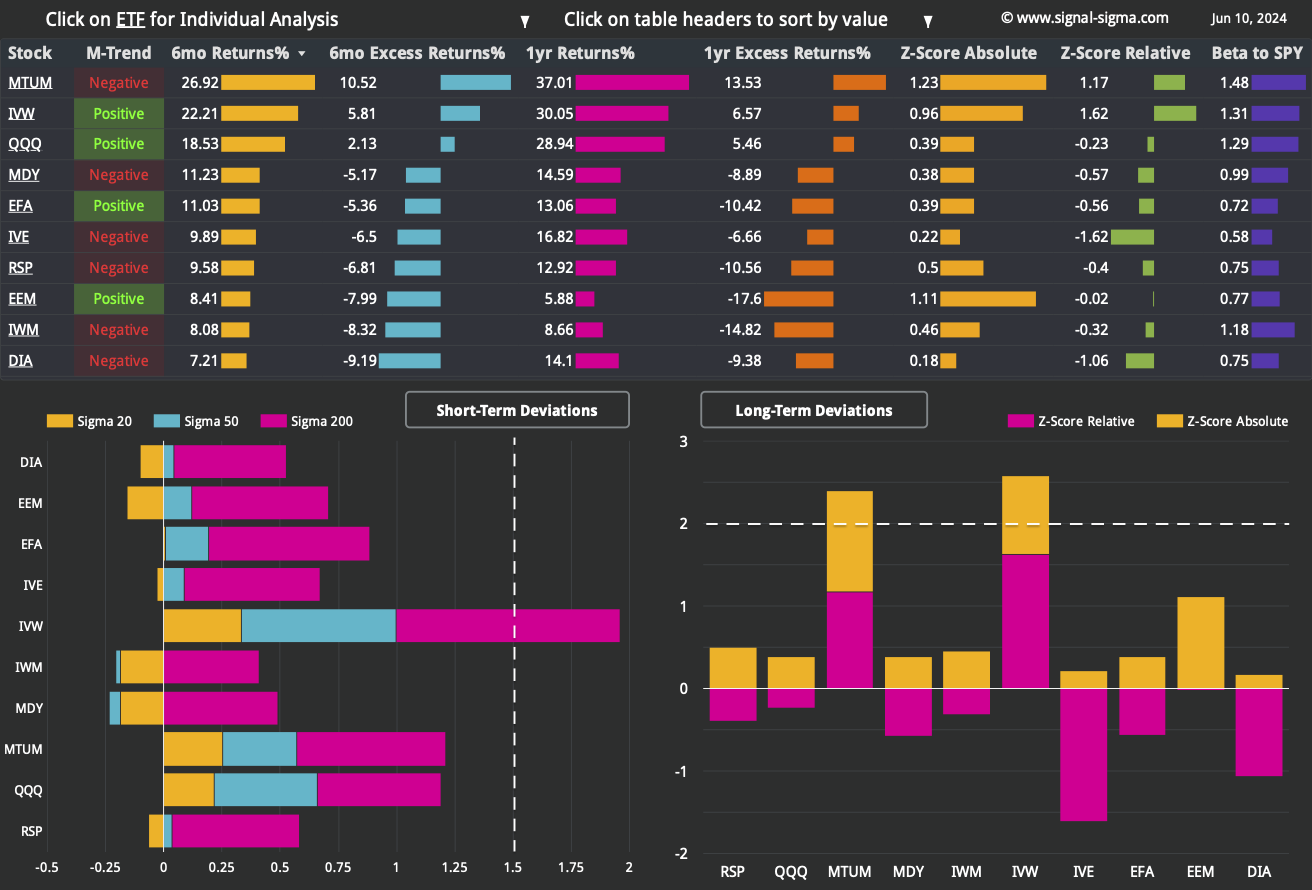
Many Factor ETFs are now extremely oversold in the short term. Notably, all ETFs with the exception of the foreign focused ones (EEM and EFA), have been able to hold above their respective 200-DMAs.
Momentum Factor ETF (MTUM), Growth Stocks (IVW) and iShares Russell 2000 ETF (IWM) look well positioned for a nice rebound - however long that would last. Nasdaq (QQQ) has a huge relative performance drawdown versus SPY, as the factor notched some of the best returns previously.
Generally, we are looking for exposure to factors trading below their 50-DMAs (all of them qualify at the moment), which are also simultaneously outperforming SPY on a relative performance metric. The Equally Weighted S&P500 (RSP), the Dow Jones Industrial Average ETF (DIA). Value Stocks (IVE) and Emerging Markets (EEM) also make the cut.
When so many factor ETFs are buyable, our read is that a technical short term bounce is in the books.
Among more granular Factor Returns, dividend paying companies have been performing great in the short term, since the market perceives them as relative safe havens - similar to treasuries.
R&D / Gross Profit - a popular factor earlier in the year - is now completely out of favor at the short term. Companies with a high proportion of R&D spend are usually high growth + low (or even negative) EBITDA companies. As we know, these companies have been rotated out of - maybe excessively at this point.

Here’s how we stand on the Sectors front:


We have included 3 former tables from previous articles, for your convenience.
The first observation that stands out from the sector leaderboard is the huge downside extension present in Tech (XLK). This is happening both at the short and at the long term. Tech is now flirting with 2-standard deviations of drawdown, near bear market territory. This could make for a compelling short term case in favor of XLK, but we would prefer allocating toward sectors that are actually outperforming.

Nostromo has come alive, seemingly out of nowhere! Our quirky tactical allocation model has employed leverage efficiently and is now closing the gap to its benchmark.
For the moment, its allocation is quite traditional, holding an unspectacular 59% stocks / 43% bonds portfolio.
The equities part is made up mostly of shares in Basic Materials (XLB), along with a 9% position in Emerging Markets (EEM). The strategy is looking to buy a lot of other factor ETFs (RSP, IWM, DIA, MDY) - whenever BUY signals are detected. This will leverage the portfolio up again.
While underperforming in real life, this quirky model has its uses as a decision support tool. Nostromo has missed out on the rally since the October 2023 lows mainly due to its reliance on “trade signals” and lack of a minimal constant allocation quota. Nevertheless, it’s also illustrative to understand why underperformance can also stem from under-allocation and “waiting for the right time to invest”. If that time never comes, the opportunity cost is hard to make up.
3. Individual Stock Selection

The Millennium Alpha portfolio has shifted its factor correlation meaningfully since the last check-up. It is now primarily exposed to mid and small caps + value stocks. Momentum comes only in the 4’th place.
As far as sectors are concerned, Industrials, Tech and Healthcare carry the highest exposure. Millennium Alpha has performed fair during the recent drawdown (although our simulation is yet to complete fully and reflect this).
As per usual, you can tweak Millennium Alpha’s selection system using your own inputs if you wish.
4. Market Environment
The next step in our process is to take into account the type of market environment that we are currently trading in. For these purposes we use the Market Internals and the Market Fundamentals Instruments. Comments on the overall state of the market can usually be found in our Weekly Preview Article.
Market breadth does not look very good at the moment. There’s been a clear downtrend occurring since the start of 2024, in the number of stocks trading above their 200-DMAs. Despite the recent outperformance of small-caps, breadth looks limiting at the moment.
Moreover, in contrast to various other times when the market was oversold and near a short term bottom, we are not seeing any sign of a bottoming process here.
Bearish Signal in Stocks trading above their 200-day Moving Averages
As a contrarian indicator, sentiment works best near extremes. Despite all of the doom & gloom on social media and traditional channels, our proprietary metric only registers “Fear” - not “Extreme Fear”.
Investors are not running for the hills just yet. We need to be patient and let the current episode run its course before positioning ourselves in a contrarian long fashion.
Neutral Signal in Sentiment
The comparison of Z-Scores reveals the disparity between large cap performance (SPY) and the top 1000 stocks by dollar volume (the broad market), equally weighted.
For the first time since early 2023, large and small caps are registering the same level of absolute performance, reducing the disparity to just below 0. This is great news, as it shows the resilience of the average stock, despite the pullback in large caps. This indicator flips bullish.
Bullish Signal in Market Internals Z-Score
Dollar Transaction Volume has jumped to near record levels, as the selloff hit global stock exchanges. Unfortunately, high volume tends to confirm the price move, setting this indicator firmly into bearish territory.
Part of the issue here stems from the unwinding of the yen carry trade, which is a “liquidity event”. By default, such an event causes large transactions to occur at any price. We would like to see both volume, volatility and the VIX settle down, before resuming more aggressive positioning.
Bearish Signal in Dollar Transaction Volume

5. Trading in the Sigma Portfolio (Live)
After reviewing all of the above factors, it’s time to decide on the actual investing strategy for our real-life portfolio.
At this juncture, the correction process is likely not over just yet. Supply and demand dynamics dictate that volatility is set to continue - and no market goes straight up or down. Our bias currently is to de-risk our portfolio gradually, starting with unwinding our commodity positions. The overall target for asset allocation is the Enterprise model, which currently aligns with our thinking.
Since treasuries are overbought, we will take profits from this position, and re-enter at a better point later. We will withhold buying new equity positions at the moment, but speculation may occur in the short term via ETFs. We’ll take our cue from Nostromo, whenever the strategy finds BUY signals and gets leveraged.
Automated Strategies and Market Outlooks

The Sigma Portfolio (Live)
The following orders will be executed at today’s close:
SELL 10% TLT (Reduce Position to 15% from 25%)
SELL 100% of UNG (Close Position)
SELL 100% of DBC (Close Position)
SELL 100% of QCOM (Close Position)
SELL 100% of GOOG (Close Position)
SELL 2% RRC (Reduce Position to 3% from 5%)
We have also adjusted target and stop loss levels within our portfolio tracker. We will re-enter trades either when fundamental upside improves or to benefit from short term speculation. In any case, this just became a much more difficult market to navigate and we would advise caution first and foremost. Most likely, the correction will find its conclusion at prices lower than we are currently seeing.
Click here to access our own tracker for the Sigma Portfolio and understand how the positions contribute to the overall exposure profile.
In total, we stand to gain $10.274 by risking $6.902 if our targets are correct. We’ll need to work more on this risk-reward ratio as market conditions allow - especially be re-adding treasuries later on. For now, the overall volatility of the portfolio will decrease.