Portfolio Rebalance / July 09
Following the Signal Sigma Process
The approach to this article follows the step by step process described here. All visuals are sourced from various instruments available in the platform. If you are using the Portfolio Tracker, you’ll be able to see how we set it up for our own portfolio at the end of this article.
Recent fundamental and technical analysis done by us as well as various other analysts point to 2 major themes which have dominated in 2024:
Horrendous market breadth
coupled with…
An overextended and overbought market at the index level
The first half of 2024 has been almost a carbon copy of H1 2023 in terms of S&P 500 performance. As it happens, the “A.I. and rate cut” rally of last year topped on July 31’st. Today’s A.I. and rate cut rally is still going strong and may continue in the near future more than logic would predict. Meanwhile, the general backdrop features a record concentration of stocks at the top of the S&P 500: the top 5 weighted stocks make up nearly 30% of the index, as Jim Bianco points out:
We would like to remind our readers not to make too much out of either of these facts. Yes, there is an extreme imbalance between a handful of stocks driving index-level performance and the rest of the market. Yes, significant deviations exist, on a medium and longer term for the S&P 500 and the Nasdaq. However, there is no conclusive evidence that these conditions, by themselves, predict an imminent downturn. That is why our models remain substantially allocated to equity risk at the moment.
Asset Class Allocation
The first step in determining optimal portfolio positioning is taking a look at the performance of the main asset classes, and determining which are suitable for investment. The Asset Class Overview Instrument gives us a clear macro picture.
All asset classes remain investible this week.
We could repeat the technical analysis for SPY that we’ve had in the last couple of weeks. The benchmark ETF has advanced unceremoniously, with investor complacence and low volatility becoming the norm. For now, there’s no reason to suspect any reversal is due, but watch out if and when that 20-DMA support gets taken out!
Commodities (DBC) have broken above key resistance supplied by the confluence of the 50 and the 200-day moving averages. This is a bullish development for the commodity and basic material trades, since the trend is now turning to setting fresh higher lows. More bullish price action would eventually see the trading channel start to slope positively. For the moment, all that’s needed is for support to hold at $23.
Gold’s (GLD) has jumped off support and is now technically well poised to continue its rally up to $229. Bullion is not overbought, and is looking to complete its recent consolidation pattern.
TLT bounced off technical support in a widely expected short term move. The correction at the end of June was most likely due to a supply / demand imbalance due to quarter end flows. Long term bonds are well positioned from both a fundamental and a technical perspective at this juncture, and we remain long this asset class.
Enterprise, our core investment strategy, is only slightly adjusting portfolio holdings to target weight. For the most part, these remain unchanged this week.
Stocks exposure via SPY is maintained around 70% this week.
Bonds exposure (IEF) is maintained at 25.3%.
The position in GLD is maintained at around 3%.
The position in DBC is maintained, at 1.2%.
The cash position is now just slightly lower, at 0.97%.
Since this model only trades 4 ETFs, we use it to judge overall portfolio positioning. The strategy’s risk profile is now “balanced”. We agree that this is the best way to go for now, as the longer term risk / reward ratio skews in favor of treasuries rather than equities, for multiple reasons.
2. Sector / Industry Selection
The next step in creating our portfolio positioning is to break down each broad asset class into more granular groups of assets. This will help us understand which pocket of the market is outperforming or underperforming and make our selection accordingly.
Since Equities are an investible asset class, we’ll take a look at how different Factors are performing and check for any notable opportunities.


We have included tables for this week and the prior 3 article editions in order to help you compare developments (click on the arrows or thumbnails to cycle through the tables).
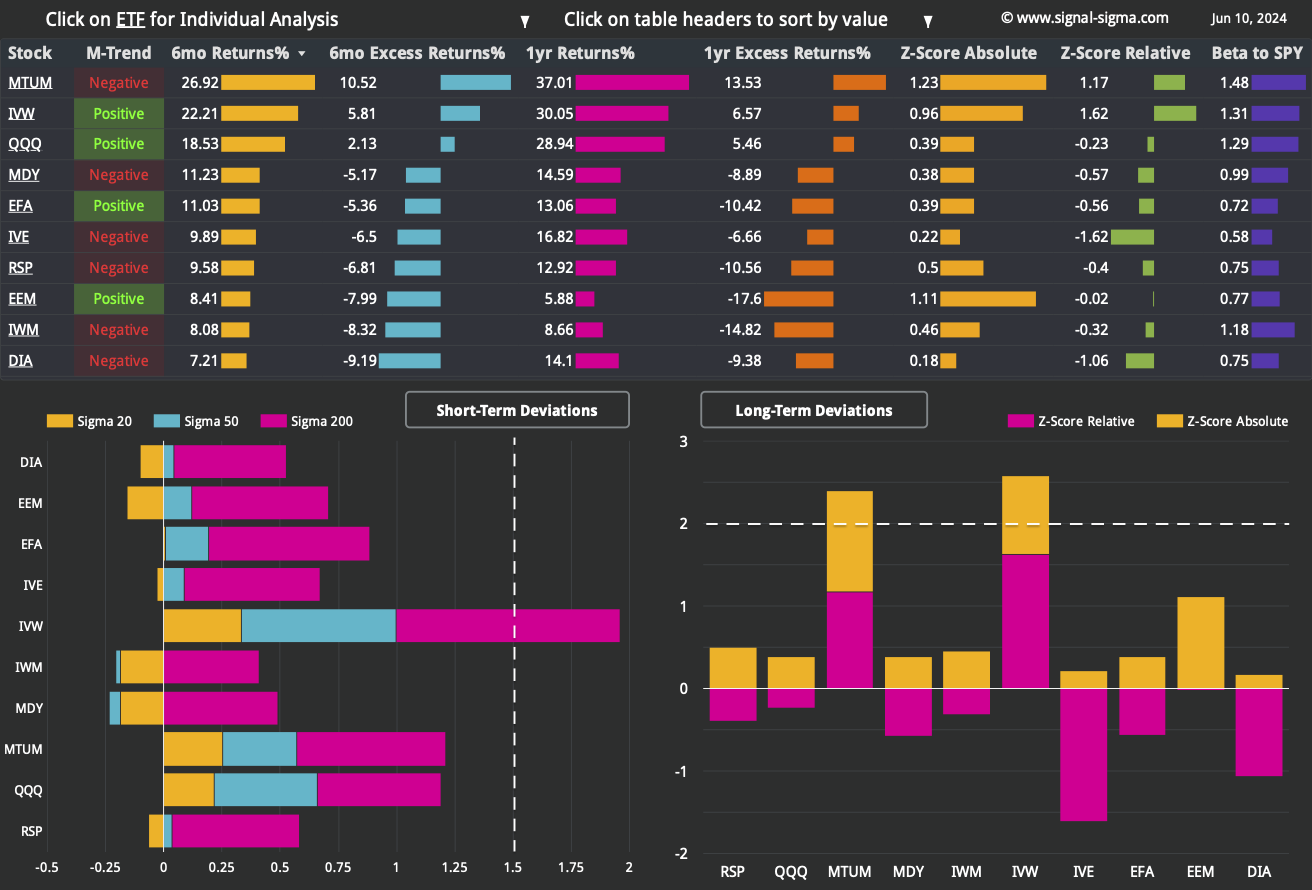
The extraordinary divergence in terms of market breadth at a factor level is visible when looking at the medium term trend for our selection of ETFs. 7/10 instruments are in a negative trend and underperforming SPY on both a 6 and 12 month basis.
The only outperforming factors remain Growth Stocks (IVW) — overbought in the short and long term— the Momentum Factor ETF (MTUM) and the Nasdaq (QQQ).
Value Stocks (IVE) are remarcable only due to their huge relative-to-SPY underperformance, which is almost literally off the charts, at a relative Z-Score of -2.42:
Curiously, QQQ has started to slip in terms of relative-to-SPY outperformance.
Among more granular Factor Returns, high growth, expensive stocks remain favored by investors right now. A high R&D to Gross Profit ratio is the number 1 factor correlated with top performing stocks all the way to the 6 month historical window. Even at the 1 year and 2 year historical windows, this factor is also performing great.
Unsurprisingly, a high Market-Cap also had an outsized correlation with top performing stocks, up to the 1-year mark. This is curious, as Market-Cap rarely comes up directly as a factor in our rankings - usually other metrics take precedence. Our take is that this may mark the “top” in the dominance of large sized companies, although we wouldn’t make an outsized bet out of this just yet.

Here’s how we stand on the Sectors front:


We have included 3 former tables from previous articles, for your convenience.
The sectors leaderboard tells a different story than the factors one in terms of market breadth, showing slightly better diversification. Only Tech (XLK) and Communications (XLC) are outperforming SPY in 2024 so that is a significant issue, but there are some other instruments showing positive momentum building up (XLY, XLRE).
Utilities (XLU) continue to correct after a spectacular rally, and we can start to initiate positions in the space as the ETF bounces from oversold conditions.

Meanwhile, Industrials (XLI) have not been able to reverse the exceptionally weak performance in relative-to-SPY terms. We’ll need to take action on positions which have too much Industrials exposure, as this sector does not look like bouncing anytime soon. The real issue is that in the event of a market-wide downturn, relative weakness is a major concern, so we wouldn’t want too much exposure here.

Nostromo continues to increase its risk-on allocation to equities via SPY, XLB (Basic Materials) and Utilities (XLU).
Bonds exposure is maintained via TLT, at a 21% weight.
Cash is sitting at -121%, as the strategy is now more than 2X leveraged. Until sell signals start to trigger, positions won’t be sold.
This model is finally starting to show some signs of life, as it is attempting to make up for the time it remained flat (0% exposure) by employing leverage at this stage.
In a certain way, this behavior is characteristic of short term traders looking to chase the market after having sit on the sidelines of the 2024 rally.
While underperforming in real life, this quirky model has its uses as a decision support tool. Nostromo has missed out on the rally since the October 2023 lows mainly due to its reliance on “trade signals” and lack of a minimal constant allocation quota. Nevertheless, it’s also illustrative to understand why underperformance can also stem from under-allocation and “waiting for the right time to invest”. If that time never comes, the opportunity cost is hard to make up.
3. Individual Stock Selection

The Millennium Alpha portfolio has been refreshed with a series of new picks. The new sector allocation tilts heavily towards Tech (XLK), with Communications (XLC) and Healthcare (XLV) as complementary sectors. On the factors side, the portfolio now features Value Stocks (IVE) as a secondary exposure to the Momentum Factor ETF (MTUM).
Additions:
Fair Isaac Corporation (FICO)
NetApp Inc (NTAP)
Halozyme Therapeutics Inc (HALO)
Arista Networks (ANET)
Wingstop Inc (WING)
Removals:
Powell Industries, Inc. (POWL)
Colgate-Palmolive Company (CL)
Vertex Pharmaceuticals Incorporated (VRTX)
Comfort Systems USA, Inc. (FIX)
Abercrombie & Fitch Co (ANF)
Despite slipping versus SPY on a relative basis last month, our core model is still up 29% Year-to-Date.
As per usual, you can tweak Millennium Alpha’s selection system using your own inputs if you wish.
4. Market Environment
The next step in our process is to take into account the type of market environment that we are currently trading in. For these purposes we use the Market Internals and the Market Fundamentals Instruments. Comments on the overall state of the market can usually be found in our Weekly Preview Article.
Market breadth has been steady in the past week, maintaining a negative composure. The typical stock is now trading slightly above one of its key moving averages (that’s what a Sigma Score of 0.05 tells us). In contrast, SPY’s Sigma Score is 1.91, signaling a much higher deviation above its moving average than a typical stock. This situation can correct in the event that the broad market rallies while SPY does not advance.
Bearish Signal in Stocks trading above their 200-day Moving Averages
As a contrarian indicator, sentiment works best near extremes. For a while, our sentiment metric has been pinned near the “Neutral” reading. There is no exuberance present, despite indices hitting all time highs, and there’s obviously no doom and gloom to be seen anywhere. This is what truly neutral markets feel like.
Neutral Signal in Sentiment
The comparison of Z-Scores reveals the disparity between large cap performance (SPY) and the top 1000 stocks by dollar volume (the broad market), equally weighted.
The trend in Z-Score Divergence continues to favor large caps, as the trend in the lower panel (signaling the divergence itself) shows no sign of turning at the moment.
Bearish Signal in Market Internals Z-Score
Dollar Transaction Volume has dropped off a cliff during the latest sessions. Given that our calculation incorporates the July 4’th holiday, thin trading does not come as a complete surprise. However, strictly from a technical perspective, low liquidity near record highs is not bullish.
Bearish Signal in Dollar Transaction Volume

5. Trading in the Sigma Portfolio (Live)
After reviewing all of the above factors, it’s time to decide on the actual investing strategy for our real-life portfolio.
In our sector analysis, we’ve already identified 2 trends: bullish Utilities (XLU), wary Industrials (XLI). We need to make the necessary adjustments in our portfolio single stock positions in order to reflect our findings. Millennium Alpha’s changes are also offering a degree of inspiration, supplying picks like HALO, FICO and GDDY.
At the broad asset class level, our mix is fine, and there’s little tweaking to do. So we will focus on individual stock positions this week, by removing losers, and adding potential winners instead.
Automated Strategies and Market Outlooks

The Sigma Portfolio (Live)
The following orders will be executed at today’s close, in order to better balance our sector and factor mix. The asset class allocation will not suffer any changes:
SELL 2% GWW (WW Grainger Inc) - Close Position
SELL 3% VRTX (Vertex Pharmaceuticals Incorporated) - Close Position
SELL 4% AMAT (Applied Materials, Inc.) - Close Position
SELL 4% XOM (Exxon Mobil Corp) - Close Position
BUY 5% FE (FirstEnergy Corporation) - Initiate 5% Position
BUY 3% HALO (Halozyme Therapeutics Inc) - Initiate 3% Position
BUY 3% FICO (Fair Isaac Corporation) - Initiate 3% Position
BUY 2% GDDY (Godaddy Inc) - Initiate 2% Position
We have also adjusted target and stop loss levels within our portfolio tracker. Nevertheless, our portfolio is reasonably well diversified, and our bet essentially remains that the broad market will eventually recover ground versus the main indices. It’s been exceptionally hard to keep up with SPY by holding a diversified portfolio.
Click here to access our own tracker for the Sigma Portfolio and understand how the positions contribute to the overall exposure profile. Due to today’s adjustments, the risk-reward profile has been improved. Both stops and profit targets are now higher and offer a better risk-reward proposition.
In total, we stand to gain $16.499 by risking $11.165 if our targets are correct.
Compared to last week, our sector correlation is starting to reflect more exposure to Utilities (XLU) and slightly less correlation with Industrials (XLI). The highest sector exposure by far remains Communications (XLC), with Tech (XLK) and Consumer Discretionary (XLY) rounding up our allocation.
If you have any questions, please contact us using your favorite channel. Have a great week everyone, and happy investing!
Andrei Sota