Portfolio Rebalance / June 05
Following the Signal Sigma Process
The approach to this article follows the step by step process described here. All visuals are sourced from various instruments available in the platform. If you are using the Portfolio Tracker, you’ll be able to see how we set it up for our own portfolio at the end of this article.
The market environment is currently undergoing some changes, with the following important dynamics in play:
Growth versus inflation is now posing a real conundrum, dividing investors between certain sectors and styles
The Stocks - Bonds correlation is deteriorating, as would be expected in a lower growth environment
Commodities are signaling demand issues, but Gold (and Bitcoin) trade like inflation is here to stay
Ultimately, betting on one set of assets will yield a better outcome than the other, and it’s important to correctly identify each “camp” and understand in which scenario they are set to outperform. The key visual of the week comes from the Federal Reserve Bank of New York’s “Nowcast” model, which attempts to predict GDP Growth by aggregating fundamental economic reports into a single figure.
The latest projection as of May 31’st is showing a Q2 GDP Growth expectation of 1.76%, but we are more interested in the trend of the recent data. As can be clearly seen, the trend is decelerating.
Asset Class Allocation
The first step in determining optimal portfolio positioning is taking a look at the performance of the main asset classes, and determining which are suitable for investment. The Asset Class Overview Instrument gives us a clear macro picture.
All asset classes are investible.
We’ve recently updated SPY’s technical assumptions to a base case where the benchmark ETF will rise ~10% in one year’s time. Large cap companies will do fine even in a lower growth economic environment, simply as a function of share buybacks and sheer market dominance. Solid balance sheets and better access to capital markets will allow large caps to weather a potential downturn. Potential price appreciation, of course, is not THAT inspiring.
Commodities (DBC) have been rejected from the high trend-line and pivot / resistance area of $23.6 (S1). The price move is mostly based on a collapse in crude oil futures, which have declined nearly -20% since early April. OPEC surprised the markets by announcing supply cuts, but they’re also phasing out voluntary cuts. The deal appears to be an underhanded way of increasing production. A cease-fire in Gaza (which is becoming more likely) would also negatively impact oil prices. Furthermore, U.S. demand for diesel fell to its lowest seasonal level in over 25 years, per Reuters:
Products supplied of distillate, EIA’s measure of demand, fell over 6% from February to 3.67 million barrels per day (bpd) in March, lowest for the month since 1998.
That being said, commodities are approaching support / stop-loss levels at $22.3, and there shouldn’t be a lot of downside left. Commodities would not benefit from lower economic growth, as lower demand translates into lower product prices.
Gold (GLD) has technically established a higher high in the previous week, but it looks to be entrenched in a consolidation pattern for now. Gold should not benefit if growth / inflation proves to be lower than expected.
Long term treasuries (TLT) should benefit the most from a low growth / low inflation environment. While slow to react to incoming data, bonds have finally broken out above the 200-DMA, from a fairly low level with great risk / reward. Nostromo is also long bonds in size. We like this trade and you’ll see this reflected in the Sigma Portfolio as well.
Naturally, if inflation re-accelerates, this investment won’t work out. The downside appears to be minimal, however.
Enterprise, our core investment strategy, maintains a similar allocation to last week, with minimal adjustments.
In terms of equity risk exposure, SPY is maintained at around 67%.
Bonds exposure (IEF) stays at 20.8%.
The position in GLD is slightly increased, at 4.95% from 4.7%.
The position in DBC is also maintained at 2%.
Overall, Cash is slightly decreased, from 5.7% to 5.17%.
Since this model only trades 4 ETFs, we use it to judge overall portfolio positioning. The strategy’s risk profile is balanced, almost in line with its 60-40 benchmark. We agree with the model’s positioning.
2. Sector / Industry Selection
The next step in creating our portfolio positioning is to break down each broad asset class into more granular groups of assets. This will help us understand which pocket of the market is outperforming or underperforming and make our selection accordingly.
Since Equities are an investible asset class, we’ll take a look at how different Factors are performing and check for any notable opportunities.


We have included tables for this week and the prior 3 article editions in order to help you compare developments (click on the arrows or thumbnails to cycle through the tables).
The Factors leaderboard paints a mixed picture. Many ETFs are still trading in negative medium-term trends. Growth oriented ETFs (QQQ, IVW) as well as foreign ETFs (EFA, EEM) are favored from a technical perspective.
Short term, there are no notable deviations. Nasdaq (QQQ), Growth Stocks (IVW) and Foreign Developed Markets (EFA) are trading above all key moving averages in a healthy way (not too extended).
Longer term, the Momentum Factor ETF (MTUM) is no longer overbought, while Value Stocks (IVE) are exceptionally underperforming SPY.
In a slowing growth and inflation scenario, QQQ, IVW and MTUM should (in theory) be at a disadvantage, since a lot of growth is already priced in current valuations. The iShares Russell 2000 ETF (IWM) also contains a subset of economically sensitive stocks, which should be vulnerable to any economic slowdown. The current setup does not confirm a “growth slowdown” narrative like we’ve been seeing in the actual data. Value stocks (IVE) should be the most resilient to a downturn, as this is the lowest beta factor.
Among more granular Factor Returns, the Debt Ratio has been a marker of performance in the near term, along with Gross and Net Profit Margin.
Longer term, there’s no particular factor really dominating the rankings. Earnings Yield stands out as a metric that denotes quality companies - which tend to be favored at the 1 and 2 year marks.

Here’s how we stand on the Sectors front:


We have included 3 former tables from previous articles, for your convenience.
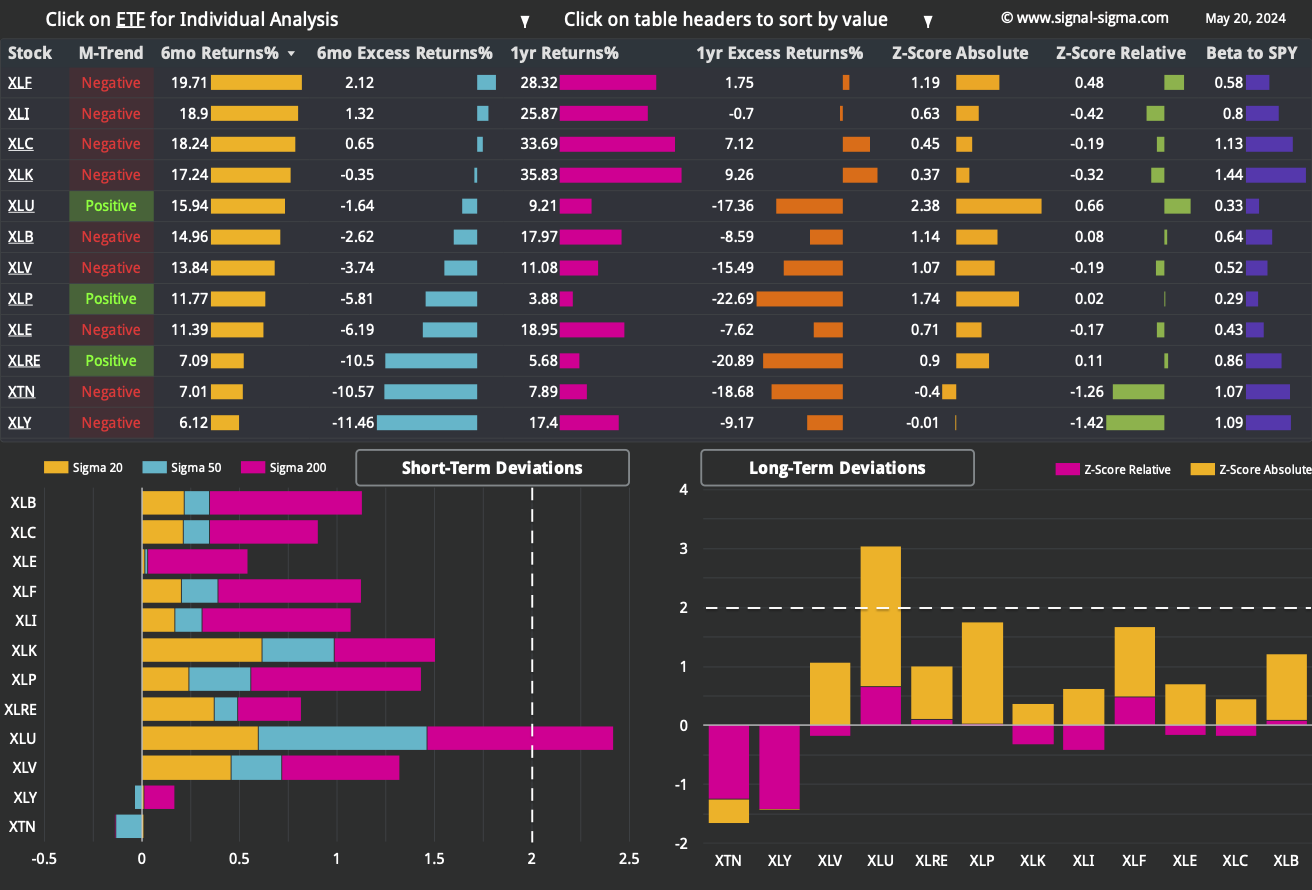
Sectors ETFs are much more widely dispersed than Factors, as investors clearly prefer a set of industries over another. Utilities (XLU) are the big surprise of the group, with an amazing run in absolute terms. Normally, Utilities are a defensive sector which does not rally near all-time highs in tandem with the S&P 500 or the Nasdaq.
On that note, Staples (XLP), another traditionally defensive sector is also doing surprisingly well. Investors also prefer Utilities and Staples for their stable dividends, and sometimes they trade as bond proxies. Clearly, companies from these industries are also able to pass down inflation to the consumer in the most efficient way (if the price of soap rises, are people not going to take showers anymore?). The rise of both sectors bodes well for bonds and can work in a stagflation environment as well.
Transports (XTN) and Consumer Discretionary (XLY) on the other hand, are vulnerable to consumers’ disposable income. Both of these sectors ETFs are underperforming on a longer term basis. Industrials (XLI) also look vulnerable to any economic slowdown, though their recent underperformance may simply be due to profit taking.
The pullback in Financials (XLF), a previously overbought sector, also looks like a technical buying opportunity. Needless to say, Financials are extremely economically sensitive, so it’s a bet that can go awry very fast.
Nostromo has switched to a surprisingly balanced allocation.
It is currently buying the breakout in long term treasuries by initiating a 21% position in TLT to its portfolio.
On the equity side, a 55% position in Basic Materials (XLB) is maintained, and targeted for selling on the appropriate signal.
If a buy signal triggers in SPY, Nostromo will add that position as well.
While underperforming in real life, this quirky model has its uses as a decision support tool. It’s also illustrative to understand why underperformance can also stem from under-allocation and “waiting for the right time”. If that time never comes, the opportunity cost is hard to make up.
3. Individual Stock Selection

Both of our core Millennium models (Alpha and Vol Target) have hit a bit of a rough patch in the past week, underperforming SPY. The pullback in the broad market has disproportionately affected industrials and momentum correlated stocks. As can be seen from the exposures pie charts above, these 2 styles are prevalent in Alpha’s portfolio, so the drawdown was inevitable.
The monthly portfolio refresh has brought about a single change:
SOLD: Wingstop Restaurants (WING)
BOUGHT: Vertex Pharmaceuticals Inc (VRTX)
We’ll need to also do a bit of work and clean up our own portfolio according to the latest rankings.
As per usual, you can tweak this system using your own inputs if you wish.
4. Market Environment
The next step in our process is to take into account the type of market environment that we are currently trading in. For these purposes we use the Market Internals and the Market Fundamentals Instruments. Comments on the overall state of the market can usually be found in our Weekly Preview Article.
The number of stocks above their 20 and 50 day moving averages has not really rebounded with the market. While SPY is hitting all-time highs, we can’t detect the same bullish impetus in most stocks, which are trading below their 20-DMAs.
Depending on your own view, this is either bullish or bearish. It could be bullish in the sense that the broad market has “catching up to do”. And it could be a bearish signal, in the sense that the market is narrow again, with only a couple of stocks accounting for most of the gains. If those key stocks are missing from your portfolio, performance is lacking.
Neutral Signal in Stocks trading above their 200-day Moving Averages
As a contrarian indicator, sentiment works best near extremes. Today, market sentiment is as close to “Neutral” as possible. We’re noticing a wedge pattern forming on the chart, as fluctuations in this metric are becoming narrower. This is a subtle indication that we are trading in a “continuation” environment (as opposed to “range trading”). In this type of market, we’ll see fewer extremes in both bullish and bearish readings compared to the recent past.
(It’s the recent past that helps set the upper and lower limits of this indicator).
Neutral Signal in Sentiment
The comparison of Z-Scores reveals the disparity between large cap performance (SPY) and the top 1000 stocks by dollar volume (the broad market), equally weighted.
The Z-Score divergence has steadily increased during the whole month of May. It’s gotten especially ugly during the past couple of sessions, as large caps bounced and the broad market fell. We’ll downgrade this signal from “Bullish” to “Neutral”.
Neutral Signal in Market Internals Z-Score
Dollar Transaction Volume has climbed to above average. In the context of a rising market and sessions which have seen spectacular rallies near the close, we’ll chalk this indicator up to the bullish camp, as it demonstrates a resilient market. Also, there is a theory that “smart money” is doing the buying near the close, so this is another positive.
Bullish Signal in Dollar Transaction Volume

5. Trading in the Sigma Portfolio (Live)
After reviewing all of the above factors, it’s time to decide on the actual investing strategy for our real-life portfolio.
Automated models are strongly allocated to risk at this juncture. We will increase exposure cautiously as well, targeting the asset allocation of the Enterprise strategy.
Automated Strategies and Market Outlooks

The Sigma Portfolio (Live)
With a resilient market pushing higher, we need to cautiously increase equity exposure toward our target. We’ve already increased treasury allocations yesterday via adding 6% to TLT, and today we are performing some more portfolio actions. Below, you’ll see an example of our rebalancing mantra: “Buy what works and sell what does not. Only losers add to losers.”
First of all, we need to close positions which are not working (similar to pruning a garden and removing the weeds). In our case, one of these positions is Snap-on Inc. (SNA).
Then, we’ll add 2% exposure to XOM (on the dip) and META (on a level breakout). Both of these stocks have been working for us, generating positive returns. We are initiating a position in Millennium Alpha position POWL, also on a -20% dip. And to round up our exposure increase, we like Alpha’s VRTX pick as well, and think that upside is considerable on the stock. Our target for VRTX is $545.
To sum up, we are executing the following orders at today’s close:
SELL 100% SNA (Close Position)
BUY 2% XOM (Add 2% to Position)
BUY 2% META (Add 2% to Position)
BUY 2% POWL (Initiate a 2% Position)
BUY 2% VRTX (Initiate a 2% Position)
Overall, equity exposure in the portfolio will rise from 60% previously to 63% at today’s close.
Click here to access our own tracker for the Sigma Portfolio and understand how the positions contribute to the overall exposure profile. As of the latest pullback in the market, our risk-reward profile has improved dramatically, and is now close to the desired 2-1 (for every dollar risked, we should gain 2).
In total, we stand to gain $18.590 by risking $10.726 if our targets are correct.
In terms of Factor correlations, exposure is very well balanced.