Portfolio Rebalance / June 12
Following the Signal Sigma Process
The approach to this article follows the step by step process described here. All visuals are sourced from various instruments available in the platform. If you are using the Portfolio Tracker, you’ll be able to see how we set it up for our own portfolio at the end of this article.
The market has been trading in a holding pattern in anticipation of the FOMC meeting and the latest CPI inflation report. Main index benchmarks have been closing at all time highs in recent sessions, but the market has been weak underneath. NVDA is up +34% in the last month alone, and has been largely responsible for pushing the S&P 500 higher, along with a handful of other stocks.
A concentrated market trading on thinner than average volume is not particularly healthy. In contrast, our automated models are “all-in” on risk, similar to some of the “degen” traders out there betting their savings on 0-dte options for meme stocks. We need to maintain a balanced approach to risk taking, allocating towards the areas of the market that offer a good risk-reward ratio and avoiding the most vulnerable industries.
Asset Class Allocation
The first step in determining optimal portfolio positioning is taking a look at the performance of the main asset classes, and determining which are suitable for investment. The Asset Class Overview Instrument gives us a clear macro picture.
All asset classes are investible this week.
SPY is grinding higher in a low volatility fashion, with downside well constrained by its 20-Day Moving Average, acting as near term support. Stock buybacks and the tendency for a couple of mega cap stocks to drive index performance hide the fact that the market is fragile underneath the surface. At the moment, there is no reason to become overly concerned or defensive in terms of equity risk allocation, as long as individual positions in portfolios are performing well and support holds.
Commodities (DBC) have bounced from the late March consolidation level and are now trading in the middle of a wide range, not yet oversold (35/100), but clearly no longer overbought. This is starting to look like a compelling entry point, especially in the oil (USO) and nat gas (UNG) sub-components.
After the post-pandemic run-up, the Ukraine war, and unrest in the Middle East, Wall Street was expecting oil prices to soar above $150/bbl. However, as is almost always the case, those exuberant estimates rarely actually come to pass. Instead, oil prices have fluctuated around $70/bbl, enough to be profitable for a large share of producers and not enough to impede demand and economic activity.
Natural gas, which is expected to power the next generation of AI data centers, is still languishing near cycle lows.
The rally in Gold (GLD) has stumbled recently, with bullion being able to maintain R1 technical support at the moment. This is a fine entry point for a starter position, but there is a risk that more downside can follow. The extension from its 200-Day Moving Average is quite large for gold here, so a bit of extra caution is warranted.
Long term treasuries (TLT) have been able to maintain support following Friday’s Non-Farm Payrolls data. The market has focused on the headline jobs number (272K) and increased average hourly earnings (+4.1% YoY vs 3.9% expected) to justify a selloff in bonds. Our belief is that this weakness is misplaced, and we’ve actually witnessed a terrible report, with mounting full-time job losses and increasing part-time employment. Furthermore, the rising unemployment rate (4%) and declining participation rate (62.5%) does not exactly scream “inflationary / strong jobs market”.
We’ll get a clearer picture following the CPI data, but we are bullish bonds at this juncture.
Enterprise, our core investment strategy, has boosted stocks ownership by a significant amount, to the detriment of cash and bonds, primarily.
In terms of equity risk exposure, SPY is increased from 67% previously, to 80% today.
Bonds exposure (IEF) declines from 20.8% last week to 15.17% presently.
The position in GLD is slightly decreased, to 3.16%.
The position in DBC is also decreased slightly at 1.43%%.
Overall, Cash is now minimal, at only 0.57% weight.
Since this model only trades 4 ETFs, we use it to judge overall portfolio positioning. The strategy’s risk profile has now turned aggressive, with one of the highest equity allocations on record.
2. Sector / Industry Selection
The next step in creating our portfolio positioning is to break down each broad asset class into more granular groups of assets. This will help us understand which pocket of the market is outperforming or underperforming and make our selection accordingly.
Since Equities are an investible asset class, we’ll take a look at how different Factors are performing and check for any notable opportunities.


We have included tables for this week and the prior 3 article editions in order to help you compare developments (click on the arrows or thumbnails to cycle through the tables).
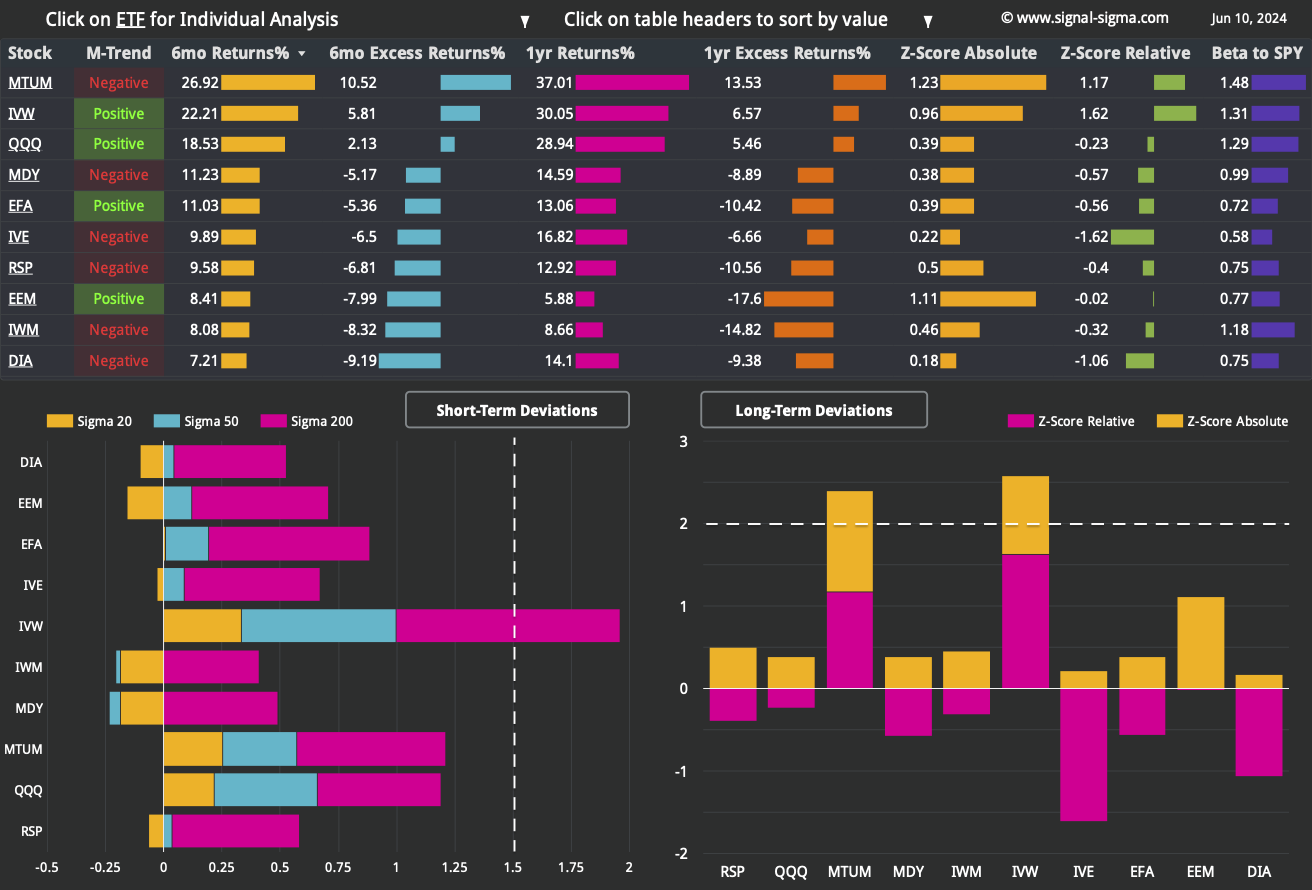
The Factors leaderboard looks mostly balanced in the short term, with minimal extreme deviations being recorded. Growth Stocks (IVW) continue to be highly extended in the short term, owing up to the high market cap companies included in the ETF. Every factor ETF is trading above its 200-DMA, with 4 out of 10 issues registering a positive trend in the medium term.
The iShares Russell 2000 ETF (IWM) and Mid-Caps (MDY) look weakest here, unable to maintain support above their 50-DMAs.
Longer term, the Momentum Factor ETF (MTUM) and Growth Stocks (IVW) are grossly outperforming in relative-to-SPY terms. With the exception of these 2 and QQQ, every other factor is being outperformed by SPY at the 6-month and 1-year historical window.
Conversely Value Stocks (IVE) are grossly underperforming SPY and we would steer clear of this factor for now.
Among more granular Factor Returns, a high R&D / Gross Profit (common in growth companies) is ruling the leaderboards at short and medium time horizons.
Longer term, there’s no particular factor really dominating the rankings. The Pietroski F-Score scores high at the 1 and 2 year mark, but tapers off on shorter timeframes.

Here’s how we stand on the Sectors front:


We have included 3 former tables from previous articles, for your convenience.
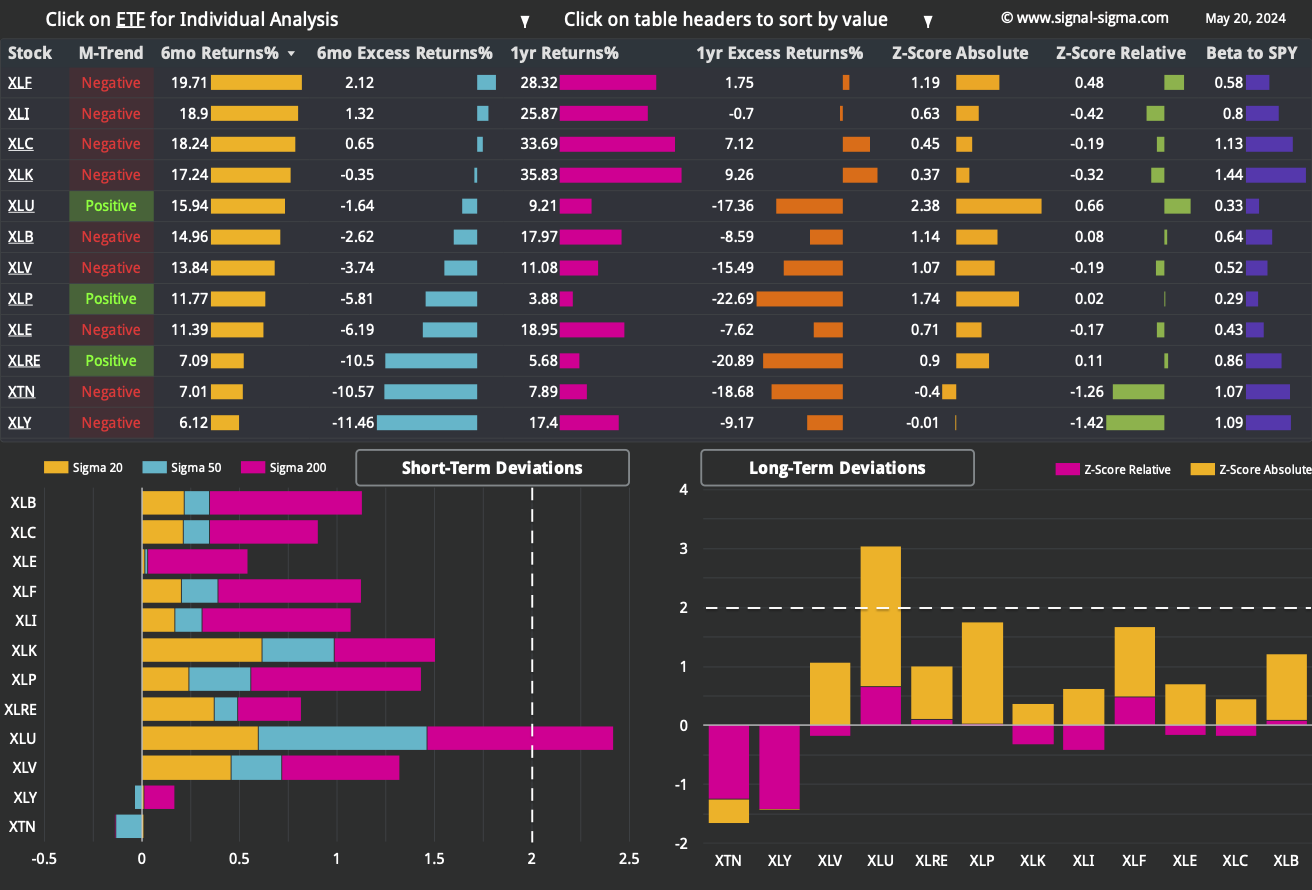
Sectors ETFs continue to remain dispersed in terms of absolute and relative performance. A more positive picture of market breadth emerges, as 6 / 12 sectors trade in a positive medium term trend.
However, with the sole exception of the Communications ETF (XLC), every other sector has underperformed SPY in the last 6 months - another piece of evidence illustrating the high concentration found at the top of the market.
This is an environment where we’d rather identify the weak industries and avoid them. Industrials (XLI), Transports (XTN) and Consumer Discretionary (XLY) stand out as the largest relative underperformers in the longer term. We will do our best to avoid exposure in these areas.
Short term, the weakest sector is Energy (XLE), trading well below its 20 and 50-DMA, but we view the current pullback as an opportunity to add exposure. Meanwhile, despite the longer term unfavorable disposition, Consumer Discretionary (XLY) is trading above all key averages.
Our preference remains towards Tech (XLK), Healthcare (XLV), Communications (XLC) and Financials (XLF). These sector ETFs have been able to hold their own relative to SPY.
Nostromo is now very much risk-on, owning stocks via SPY and XLB (Basic Materials) ETFs.
Bonds have been reduced, via the SELL order in TIP executed yesterday.
Cash is sitting at -32%, as the strategy is leveraged toward equities especially. If XLB generates a SELL signal, the position will be closed out and cash levels will return to normal.
While underperforming in real life, this quirky model has its uses as a decision support tool. It’s also illustrative to understand why underperformance can also stem from under-allocation and “waiting for the right time”. If that time never comes, the opportunity cost is hard to make up.
3. Individual Stock Selection

Millennium Alpha has just hit another all-time-high value during live-trading, as it is nearing its 1-year anniversary. The portfolio is primarily correlated to Momentum and Growth in terms of factors as well as Tech and Industrials on the sectors side. It has just finished rebalancing each position back to target weight (taking profits on winners and buying losers).
NVDA is, of course, fueling the ascent of our model, as it has been the main growth engine for the entire market. But don’t discount such stocks as META and ANF, which have also generated handsome returns as well.
To keep outperforming, this strategy needs positive market breadth to a certain extent. Weather we get that or not in the next leg of the market is the real question - otherwise, any stock picking model will become vulnerable to a downturn.
As per usual, you can tweak this system using your own inputs if you wish. We’ve recently doubled the scoring of the “Market Cap” metric when using this system discretionarily in order to favor larger companies.
4. Market Environment
The next step in our process is to take into account the type of market environment that we are currently trading in. For these purposes we use the Market Internals and the Market Fundamentals Instruments. Comments on the overall state of the market can usually be found in our Weekly Preview Article.
There is currently a large divergence in market breadth that we are registering. The Sigma Score difference between the average stock and SPY is sitting at +1.59. This tells us that an average stock is trading right about at the middle of its moving average deviation (that’s a Sigma Score of 0), while the index tracking ETF is highly overbought by comparison.
The trend that we can spot on the bar chart is also pretty much self-explanatory. The market going ever higher while stocks fall incrementally behind various moving averages is not good.
Bearish Signal in Stocks trading above their 200-day Moving Averages
As a contrarian indicator, sentiment works best near extremes. Same as last week, we are registering an almost perfect “Neutral” reading in the broad market, which is strange given the record highs reached at the index level.
Neutral Signal in Sentiment
The comparison of Z-Scores reveals the disparity between large cap performance (SPY) and the top 1000 stocks by dollar volume (the broad market), equally weighted.
With capital flowing to a handful of names that drive performance and “everything else” trading flat, it’s no surprise to see this measure move back up. Sure, the disparity has been larger in the past (July 2023 and February 2024), but the direction is bearish for broad market exposure.
Bearish Signal in Market Internals Z-Score
Dollar Transaction Volume has suddenly dropped below the recent average again. On “higher highs”, this type of liquidity drain is not helpful and not “confirming” of recent price action. Lower volume on higher prices is bearish.
Bearish Signal in Dollar Transaction Volume

5. Trading in the Sigma Portfolio (Live)
After reviewing all of the above factors, it’s time to decide on the actual investing strategy for our real-life portfolio.
Automated models are strongly allocated to risk, but market breadth is negative on too many counts to ignore. While our fundamental analysis leaves room for SPY to gain around 8.4% in the best case scenario, this does not appear to be the optimal time to take on excess levels of risk. There is no obvious “fat pitch” here.
That being said, a more defensive allocation would require levels of market “euphoria” that we are currently not seeing. Sticking to our target (60% equities) and tilting risk slightly above that makes the most sense right now.
Automated Strategies and Market Outlooks

The Sigma Portfolio (Live)
Yesterday's trading had the explicit purpose of removing under-performing positions from our portfolio, and according to ou latest analysis, that includes positions which are heavily correlated with small and mid caps (IWM & MDY).
However, we do not want to reduce equity allocation within the portfolio, so we need to re-distribute the capital within positions that we already own. Finally, we will add a starter position in Diamondback Energy Inc (FANG), benefiting from the recent pullback.
The following orders have been executed (the Trade Alert was issued yesterday).
Closing:
Adding:
BUY 1% QCOM (Add 1% to existing Position)
BUY 1% GOOG (Add 1% to existing Position)
BUY 1% AMAT (Add 1% to existing Position)
BUY 1% CL (Add 1% to existing Position)
BUY 1% VRTX (Add 1% to existing Position)
New Position:
BUY 3% FANG (Initiate 3% Position)
In total, our equity exposure will not suffer any changes, remaining slightly overweight, at 63%, same as last week.
Click here to access our own tracker for the Sigma Portfolio and understand how the positions contribute to the overall exposure profile. At the moment, due to the surge in asset prices, there is an uncomfortable amount of risk involved. While the ratio is still positive, it’s lower than we would aim for, and it’s the reason we’re not going “all in” on equity risk right now.
In total, we stand to gain $16.221 by risking $12.440 if our targets are correct.