Portfolio Rebalance / June 20
Following the Signal Sigma Process
The approach to this article follows the step by step process described here. All visuals are sourced from various instruments available in the platform. If you are using the Portfolio Tracker, you’ll be able to see how we set it up for our own portfolio at the end of this article.
In the past week, equities have advanced to such a degree that we are once again questioning the rationale for starting new positions in broad market indices like SPY. Based on our most optimistic fundamental assumptions we could see the benchmark ETF trade up to $582 by May 2024, translating to a +6.68% CAGR. However, the risk that an investor is taking during this timeframe does not compensate him adequately when compared to a 5.11% yield he could be gaining on a risk-free 1 year treasury bond, with the differential standing at just +1.57%.

Is the market wrong or are we simply not bullish enough? Our guess is that there are currently enough price-insensitive buyers out there to push supply and demand to an euphoric state before the next correction. Bidders could include companies buying back their own stock, trend following algos and dollar-cost averaging retail traders dumping savings into SPY.
As “rational investors”, our job is not to be “price insensitive”, but rather to manage risk and reward optimally.
Asset Class Allocation
The first step in determining optimal portfolio positioning is taking a look at the performance of the main asset classes, and determining which are suitable for investment. The Asset Class Overview Instrument gives us a clear macro picture.
All asset classes are investible this week.
First of all, we’d like to point out that the major asset classes have grouped up nicely in terms of 200-day performance. Gold and Equities have advanced almost equally, in what can be described as an “inflation / money printer hedge” trade. Meanwhile, treasuries and commodities have languished and have produced negative or flat returns. This pairing is highly unusual, as it is indicative of stagflation tendencies. Normally, if economic demand is strong, commodities should surge as well.
This market is telling us that artificial stimulus can be expected to inflate valuation multiples and central bank currency (gold).

SPY is trading in a predictable, low volatility manner, setting record after record. The extension to the upside is not yet extreme, and we are in that part of the bullish cycle where investors discover where resistance lies. We are not at that point yet, with all short term indicators pointing to more upside.
Commodities (DBC) have bounced previously and are now facing an exceptionally tough level of technical resistance. The cluster is formed by the convergence of both the 50 and the 200 Daily Moving Averages, as well as the S2 resistance level at $23.6. If DBC can settle higher, a real breakout can take off.
Gold (GLD) has re-confirmed support at $214 (R1) after a 2 month long consolidation process. Bullion has resolved its highly overbought condition and a position can be initiated at current levels.
If one believes the economy is headed into a low-growth, low-inflation environment, then long term treasuries (TLT) offer the best risk-reward balance out of all asset classes currently. Not only does TLT yield around 4.4% / year in dividends, but the technical upside is tremendous. To make matters even better, this upside should manifest in both a recessionary scenario, as well as a “soft landing” scenario, as in both cases yields should head lower. As long as inflation doesn’t re-accelerate…
Enterprise, our core investment strategy, has decreased equities ownership by a significant amount, upping treasuries instead.
Stocks exposure via SPY goes down from 80% previously, to 69% today.
Bonds exposure (IEF) climbs from 15.17% last week to 25.3% presently.
The position in GLD is maintained around 3%.
The position in DBC is slightly decreased, at 1.3%.
A marginal Cash position is maintained, at 1.32%.
Since this model only trades 4 ETFs, we use it to judge overall portfolio positioning. The strategy’s risk profile has now returned to “balanced”. We agree that this is the best way to go for now, as the risk reward skews in favor of treasuries rather than equities, for multiple reasons.
2. Sector / Industry Selection
The next step in creating our portfolio positioning is to break down each broad asset class into more granular groups of assets. This will help us understand which pocket of the market is outperforming or underperforming and make our selection accordingly.
Since Equities are an investible asset class, we’ll take a look at how different Factors are performing and check for any notable opportunities.


We have included tables for this week and the prior 3 article editions in order to help you compare developments (click on the arrows or thumbnails to cycle through the tables).
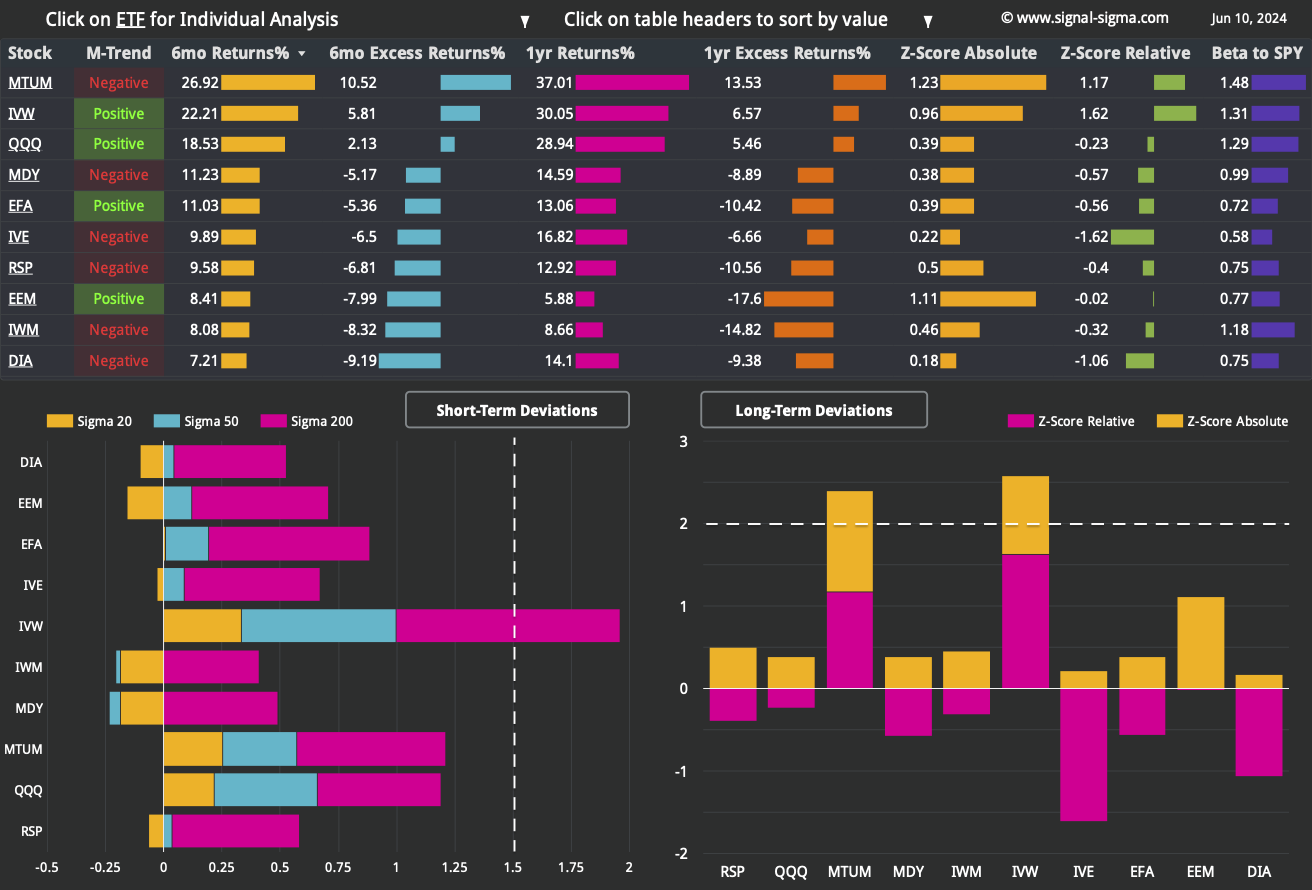
Factors are showing a bit of negative breadth emerging again, as only 3 ETFs are trading in a positive medium-term trend. They are mostly centered around the mega cap growth theme that we’ve seen performing exceedingly well recently: Nasdaq (QQQ), Growth Stocks (IVW) and Momentum Factor ETF (MTUM) all have high correlations with stocks like Microsoft (MSFT), NVIDIA (NVDA) and Applied Materials (AMAT). These are factors are working, while all of the others are simply meh.
Foreign Developed Markets (EFA) - mostly comprised of European equities, have taken a beating recently, as the European Parliamentary elections have favored conservative groups. We believe that when stocks retreat as a result of political reasons, in developed countries, it’s usually indicative of a buying opportunity.

Longer term, it’s still all about Momentum and Growth. All of the other factors are performing in an uninspiring way, to say the least. It’s an AI, tech driven market and we’re just trading in it.
Value Stocks (IVE) are grossly underperforming SPY and we would steer clear of this factor for now.
Among more granular Factor Returns, a high Return on Assets is highly correlated with strong returns in the short and medium term.
Longer term (and across all timeframes as well), a high Return on Invested Capital has been favored by investors. ROIC assesses a company's efficiency in allocating capital to profitable investments and is calculated by dividing net operating profit after tax (NOPAT) by invested capital.

Here’s how we stand on the Sectors front:


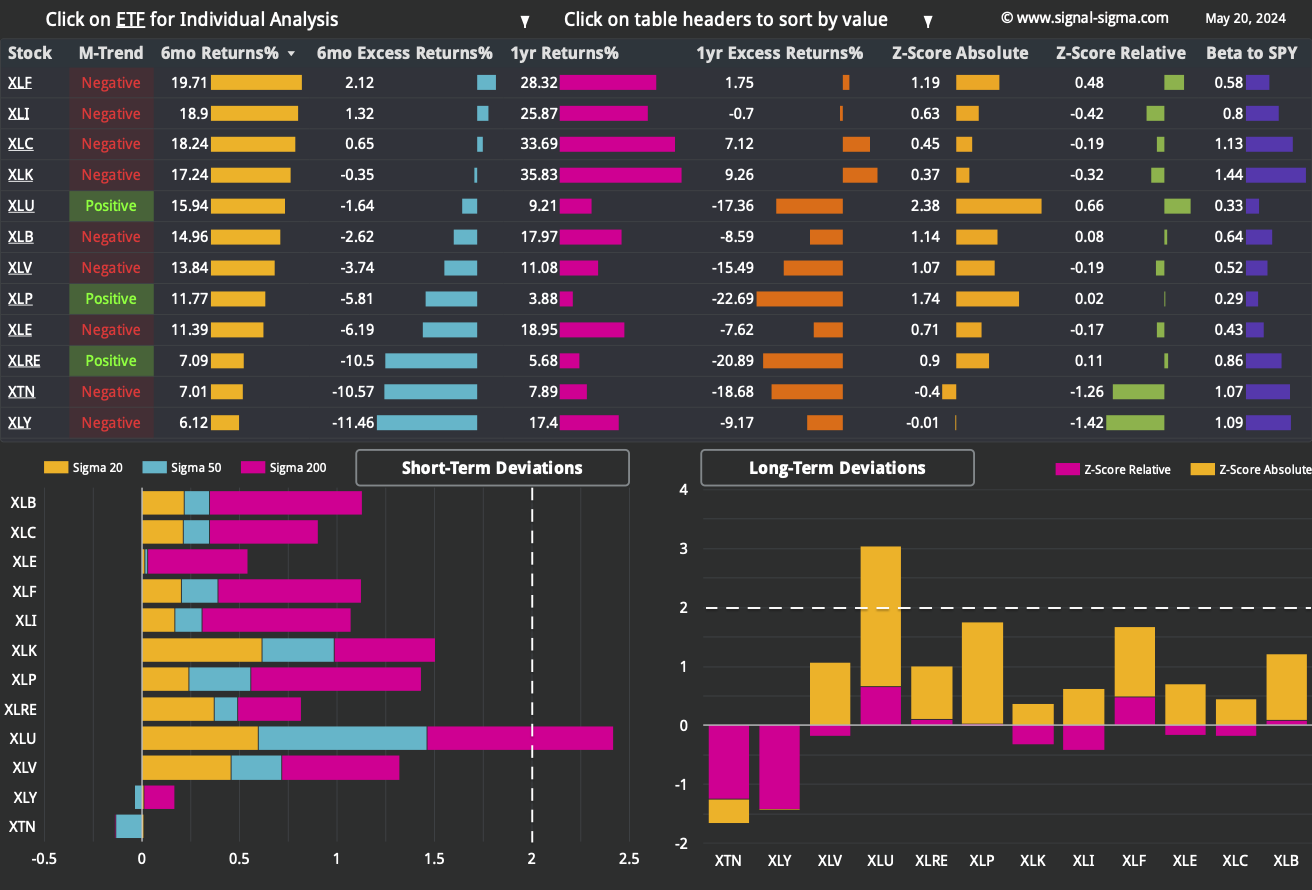
We have included 3 former tables from previous articles, for your convenience.
Sectors ETFs are currently enjoying a better breadth from a momentum perspective. 6 out of the 12 ETFs that we track are trading in a positive medium term trend.
In the short term, leadership is provided by Tech (XLK) as well as Staples (XLP) - a highly unusual pair. On a 6 month and 1 year timespan, only XLK and XLC have been able to outperform SPY, in a show of relative weakness for every other industry.
This can be seen on the long term deviations chart, where a positive Relative Z-Score is hard to come by (only XLU and XLK have it). In other words, every balanced portfolio in terms of industries has failed to keep up with an investment in SPY, aka “the market”.
Transports (XTN) and Industrials (XLI) are currently the 2 ETFs that are most oversold relative to SPY. While Industrials (XLI) is doing fairly well in an absolute sense (positive Z-Score), the weakness in Transports is worrying and could be a sign of potential trouble in the economy.
Nostromo maintains a risk-on allocation to equities via SPY and XLB (Basic Materials) ETFs.
Bonds exposure is maintained via TLT, at a 21% weight.
Cash is sitting at -32%, as the strategy is leveraged especially toward equities. If XLB generates a SELL signal, the position will be closed out and cash levels will return to normal.
While underperforming in real life, this quirky model has its uses as a decision support tool. Nostromo has missed out on the rally since the October 2023 lows mainly due to its reliance on “trade signals” and lack of a minimal constant allocation quota. Nevertheless, it’s also illustrative to understand why underperformance can also stem from under-allocation and “waiting for the right time to invest”. If that time never comes, the opportunity cost is hard to make up. The system is actively trying to do that via utilizing leverage at this point.
3. Individual Stock Selection

Millennium Alpha has been crushing the market this year, registering another Live-Trading all-time-high. The model’s exposure to the best performing sectors (XLK and XLC) as well as the #1 factor currently (MTUM) surely has helped the bottom line. This strategy is up +31.5% year-to-date, while SPY has managed an advance that’s nearly half that (+15.4%).
At one point, we expect a bout of profit taking to hit some of the very popular names. Most likely this will occur ahead of the US elections in November, as multiple macro events will converge. The average depth of a significant drawdown in this model is around -20%, occurring about once every 2 years. The last time Millennium Alpha had a -20% pullback was in 2022, so we may shift our stock picking to the lower volatility version come August and September.
As per usual, you can tweak this system using your own inputs if you wish.
4. Market Environment
The next step in our process is to take into account the type of market environment that we are currently trading in. For these purposes we use the Market Internals and the Market Fundamentals Instruments. Comments on the overall state of the market can usually be found in our Weekly Preview Article.
Despite SPY advancing to all-time-highs, movement at the individual stock level has been limited since last week. Simply put, the average stock has maintained its technical posture, but there’s been little (if any) improvement. This is not a “tide lifting all boats” and is a decidedly bearish indication.
Bearish Signal in Stocks trading above their 200-day Moving Averages
As a contrarian indicator, sentiment works best near extremes. Same as last week, we are registering an almost perfect “Neutral” reading in the broad market, which is strange given record highs. Where’s the euphoria? Why is there so much skepticism in the market?
On the one hand, the fact that there IS a healthy dose of skepticism still present is in itself an argument for the market going higher. On the other, we’re noticing a kind of wedge pattern forming in sentiment, which could translate to a sudden spike in either direction: a “blow off top” or widespread pessimism. We’ll need to wait and see.
Neutral Signal in Sentiment
The comparison of Z-Scores reveals the disparity between large cap performance (SPY) and the top 1000 stocks by dollar volume (the broad market), equally weighted.
Since the beginning of May, we’ve only seen large caps perform well. The “rest of the market”, especially on an equally weighted basis, has simply languished and this has created a wide and growing divergence that shows no sign of turning yet. Such a dynamic is clearly bearish for the average stock.
Bearish Signal in Market Internals Z-Score
Dollar Transaction Volume has bounced back to the recent average. Coupled with the positive price action recorded at the index level, this is a pleasing development. We will upgrade this indicator to “Neutral”.
Neutral Signal in Dollar Transaction Volume

5. Trading in the Sigma Portfolio (Live)
After reviewing all of the above factors, it’s time to decide on the actual investing strategy for our real-life portfolio.
Our automated models are fully allocated to risk at the moment, but it’s worth noting the way Enterprise has decreased SPY allocation this week. The bearish market internals pose a real conundrum. If we choose to be optimistic, we could say that the only part of the market left to rally are the small and mid capitalization stocks from sectors other than Tech (XLK) and Communications (XLC).
Our “balanced” approach has been costly in terms of relative performance, since many positions did not participate in this latest leg of the rally. We will continue to “buy the dip” wherever we feel like a real opportunity exists. Going forward, we will prefer to pick stocks from Millennium Vol Target rather than Millennium Alpha. We shall also re-calibrate our commodity and gold positioning.
Automated Strategies and Market Outlooks

The Sigma Portfolio (Live)
We would like to add physical gold exposure to our portfolio, following the consolidation action we’ve seen recently in the yellow metal. This is a straightforward trade which will soak up our remaining cash.
Secondly, we’ll start to shift capital from a position that has reached our price target (QCOM) to a stock pick from Millennium Vol Target that has been in our portfolio previously (GWW). Technically, we’re shifting to a less volatile position, with less MTUM and XLK correlation. This is a subtle shift, but one that should bear fruits in a couple of months.
The following orders will be executed at today’s close:
BUY 3% GLD (Initiate 3% Position)
SELL 2% QCOM (Reduce existing position by 50%)
BUY 2% GWW (Initiate 2% position)
In total, our equity exposure will not suffer any changes, remaining slightly overweight, at 63%, same as last week. Cash will go to 0% due to the trade in GLD.
Click here to access our own tracker for the Sigma Portfolio and understand how the positions contribute to the overall exposure profile. At the moment, due to the surge in asset prices, there is an elevated amount of risk involved. While the ratio is still positive, it’s lower than we would aim for, and it’s the reason we’re not going “all in” on equity risk right now.
In total, we stand to gain $16.527 by risking $11.909 if our targets are correct.