Portfolio Rebalance / May 10
Following the Signal Sigma Process
Tuesday is the day when all of our strategies rebalance their asset class holding weights. The approach to this article follows the step by step process described here.
Last week, we wrote:
The market still can’t seem to break out of the current trading range. Major asset classes have mostly been confined to a tight pattern for the past few months, with little advance either to the upside or downside. The current earnings season has so far failed to become the catalyst we were expecting. Instead, what we are getting is a lot of choppy price action from week to week, which might be bullish or bearish depending on your current view.
Our own opinion is more constructive, as headlines print from bad to worse (“Economic slowdown”, “Bank failures”, “Debt ceiling”), yet the market manages to not collapse. In this sense, no news is good news.
This week, there appears to be very little change to this overall state, with only today’s CPI Report as a potential catalyst. Data came in almost as expected, (YoY Inflation at 4.9% vs. 5% expected ; YoY Core Inflation at 5.5% vs. 5.5% expected) and there is an upside bias to markets currently.
Asset Class Allocation
The first step in determining optimal portfolio positioning is taking a look at the performance of the main asset classes, and determining which are suitable for investment. The Asset Class Overview Instrument gives us a clear macro picture.
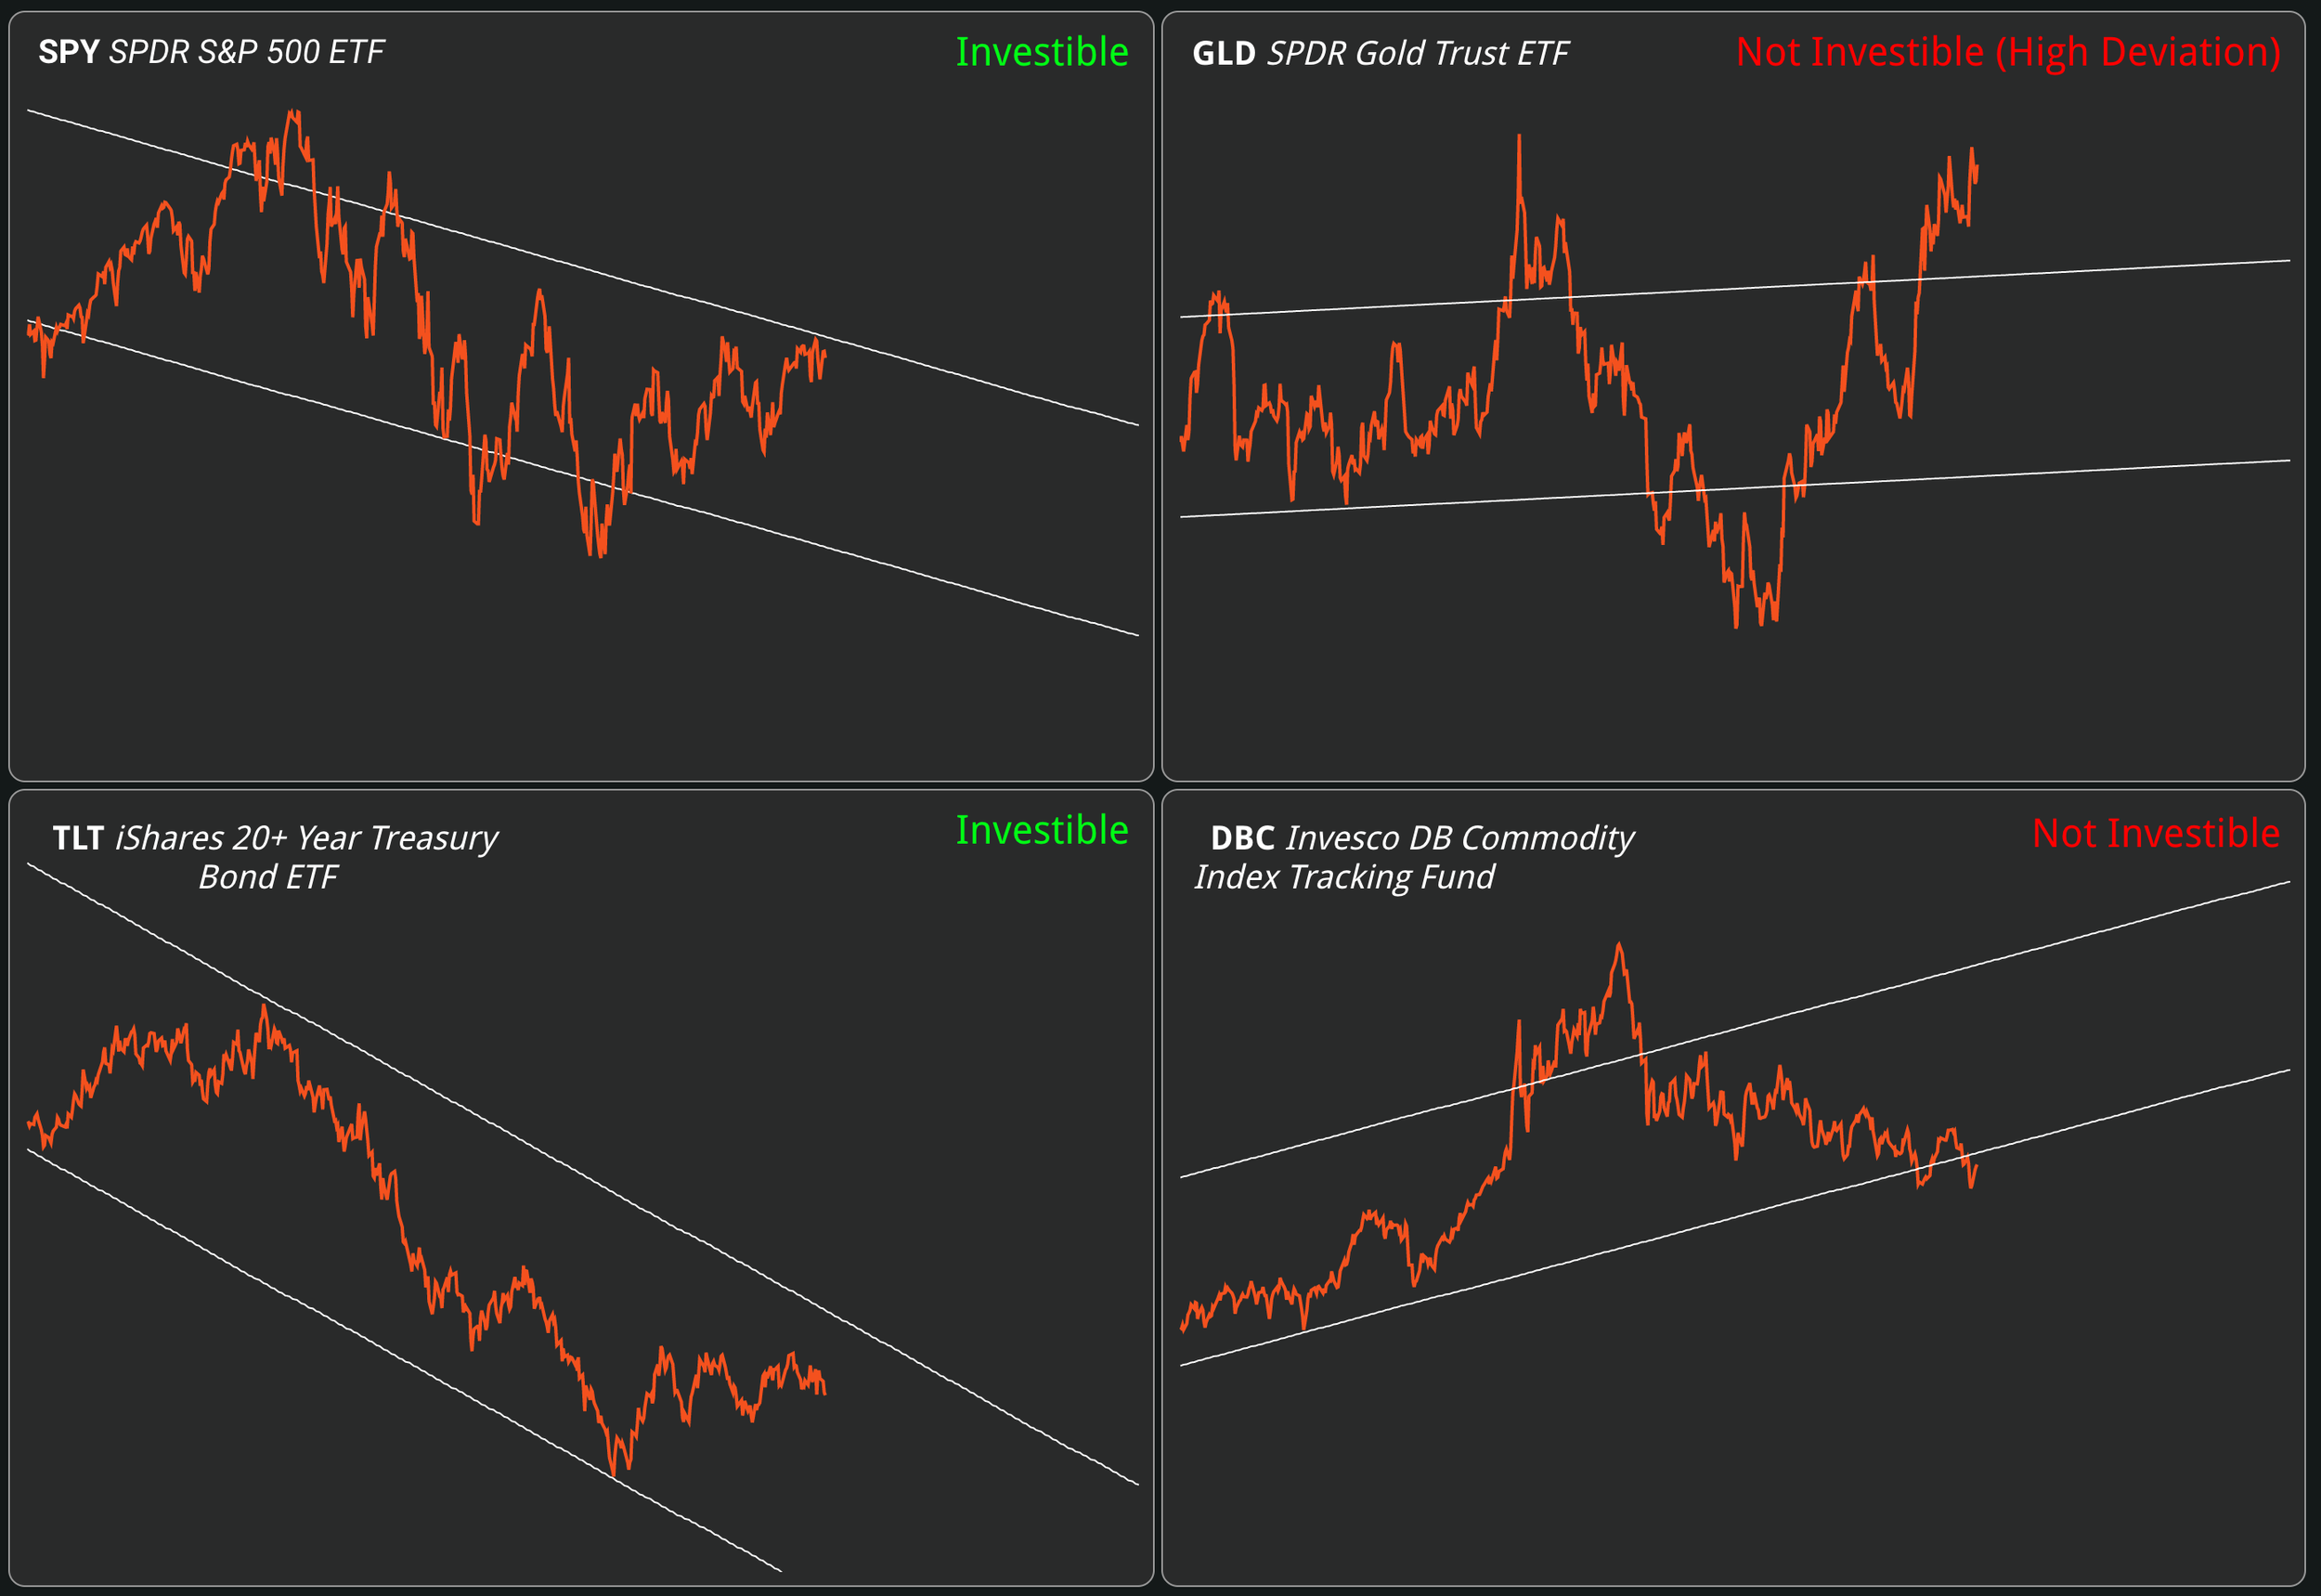
Equities and Treasuries continue to be investible, while Commodities are now trading firmly below the lower channel trend-line. Gold hovers around the $2000 / ounce price, at the high extreme of its price deviation.
The US Dollar keeps hugging the lower unadjusted Trend-Line; technically speaking, the dollar is still trading in a long and medium term uptrend, consolidating at levels which form higher lows. This is not exactly bearish, and the reserve currency’s resilience points to potential weakness in the other asset classes.

We are constantly checking for a break in the current negative correlation regime between the US Dollar (white) and every other asset class, combined (orange).
There is no change in the overall environment yet. The recent downturn for the combined asset classes makes the dollar’s rise look weak by comparison, suggesting a lower correlation is emerging. We can observe a trading channel with a similar slope form in the recent price action of both instrument sets. If this correlation weakens overall, as the latest data suggests, it would be bullish for stocks and bonds alike.

Enterprise keeps allocation unchanged from last week.
The Enterprise Strategy

Enterprise, our most conservative model, is entering the week 15% long Treasuries, and 85% in CASH.
Since this model only trades 4 asset class ETFs, we use it to judge overall portfolio positioning.
Equities are targeted for exposure at 48% of portfolio value (similar to last week), via SPY ETF. The position will be filled when SPY triggers a BUY signal without violating M-Trend support (now at $388).
The model’s treasury allocation is underweight for the time being, and is meant to be increased on the next available BUY signal (from 15% currently to 20%).
At 85% Cash is still the dominant position for this model by far.
2. Sector / Industry Selection
The next step in creating our portfolio positioning is to break down each broad asset class into more granular groups of assets. This will help us understand which pocket of the market is outperforming or underperforming and make our selection accordingly.
Since Equities are an investible asset class, we’ll take a look at how different Factors are performing and check for any notable opportunities.


We have included tables for this week and the prior 3 weeks in order to help you compare developments (click on the arrows or thumbnails to cycle through the tables).
Small Caps (SLY) remain under pressure, and the worst performing factor along with the Equally Weighted S&P500 (RSP). This is mainly due to capital fleeing from riskier stocks into large and liquid names. With economic weakness on the horizon, it is no surprise that investors are flocking to the mega cap stocks, which tend to be a safer bet in times of distress. The divergence between Small and Medium Cap stocks vs SPY continues.
On the flip side, Foreign Developed Markets (EFA) and Nasdaq (QQQ) reign as the clear out-performing factors. Growth (IVW) is catching up to these, but it’s not nearly as extended longer term and could be a good candidate for allocation.
By using our proven selection criteria (Z-Relative > 0, while Sigma 50 < 0), there are no factors that are buyable for a technical trade.
Charts Emphasis:
MDY + SLY versus SPY, illustrating the difference between the large cap index and the rest of the market.
Growth Stocks (IVW) which still has room to grow.


Here’s how we stand on the Sectors front:


We have included the last 3 weeks of tables as well, for your convenience.
Energy (XLE) continues to lead to the downside both in the short and medium term, with Financials (XLF) very close in terms of performance. Again, this reflects investor’s view of impending economic weakness, which is increasingly priced in at this point. Tech (XLK) and Communications (XLC) are leading, with both ETFs comprised of companies that are more insulated from economic downside.
Interestingly, Staples (XLP) are performing well in the short-term with the defensive sector benefiting from some degree of risk-off appetite. All of the other sectors are balanced somewhere in between.
There are no sectors that fit our selection criteria for a technical play at this point. At some point, Energy will bounce and Tech will pull back in a rotation trade, but there is little evidence of that happening yet.
Charts Emphasis:
Tech (XLK) versus SPY at 2 year highs.
Staples (XLP) - noting a sharp rally.


The Nostromo Strategy

Nostromo, our tactical allocation model, is targeting equity risk exposure via SPY. No other Sectors or Factors qualify for inclusion at this point.
On the treasuries side, Nostromo plans to allocate towards TLT on the next BUY signal.
The strategy is staying 100% in cash at this point.
For more info about how Nostromo targets sectors or factors within a broader asset class, read this article. The first part sheds some light on the selection process going on in the background.
3. Individual Stock Selection
This week, we are running a Chart Screener. A chart screener lets us immediately view the combined equity curve of the screened stocks. We wanted to re-create an equity curve similar to MDY + SLY, but using Small Cap Stocks that have the potential to “catch up” to the ETF pair.
We used the following rules:
Trend: Negative (similar to the main equity indices)
Pietroski F-Score: > 6 (quality component)
Operating Leverage: > 1 (solid business model)
Z-Score Relative: > 0 (out-performers)
Sort by the smallest 21 companies by Market-Cap

Most of these stocks have suffered heavy losses in 2022, but have rallied nicely off October lows. Each of these names could be interesting to follow up on, since they are clearly out-performing the broader small and mid-cap market in the last 6 months.
We can use the Fundamental Explorer instrument to take a deep dive into their financials. Then, use the Valuation Wizard to generate a Price Target, and see the target on a chart using Technical Analysis. We might uncover some potential candidates for our portfolio!
The Horizon Strategy

Horizon has rebalanced positions, with no major changes from last week’s portfolio on the equity side. Exposure remains similar to last week.
On the treasuries side, Horizon has replaced LQD with TLT.
This model has performed poorly as of late. It’s equity curve is more related to the Momentum Factor ETF than SPY. Momentum has lagged the broader market, and has touched previous-low levels.
As an aggressive equity exposure model, Horizon has got trapped in repeated “bear-market rallies”. Eventually, those will end sooner or later and this model will start performing closer to its historical metrics.
4. Market Environment
The next step in our process is to take into account the type of market environment that we are currently trading in. For these purposes we use the Market Internals and the Market Fundamentals Instruments. Comments on the overall state of the market can usually be found in our Weekly Preview Article.
This week, we are noting a persistent divergence between SPY’s Sigma Score (0.82 this week vs 0.84 last) and the Broad Market’s (-0.06 this week vs 0.11 last). There is also a diverging pattern between SPY and the slope of stocks trading above the 200-Day Moving Average. Neither is breaking out just yet.
With slightly less than 50% of stocks trading above each key moving average, there’s nothing really bearish about the current environment. The broad market is equally likely to catch up to SPY at some point, as it is for SPY to “catch down” to the broad market.
Neutral Signal in Stocks trading above their 200-day Moving Averages

The market has proven resilient, with repeated downturns not denting the indicator’s “neutral” disposition. This indicator works best at extremes, and now there is little it can offer us. Notably, in the lower part of the graph, the 2-std Stocks Oversold level sits significantly higher than the 2-Std Stocks Overbought level. This denotes a rather bearish past environment.
Neutral Signal in Stocks Overbought / Oversold

In terms of Z-Score divergence, the bearish difference persists, at similar levels to last week.
The same “head and shoulders” formation can be witnessed in the lower panel, for the average stock’s Z-Score. It is not showing any signs of a breakout or breakdown currently.
Neutral Signal in Market Internals Z-Score

Dollar Transaction Volume is sitting just around the average, with no notable divergence to speak of. Volatility continues to be suppressed, although there has been one reading in the past week above 1 Standard Deviation.
Neutral signal in Average Dollar Transaction Volume and Volatility

5. Trading in the Sigma Portfolio
After reviewing all of the above factors, it’s time to decide on the actual investing strategy for our real-life portfolio.
Our models continue to diverge this week, despite having the same overall targets. Nostromo and Enterprise have no exposure to equities at the moment, and Horizon’s risk profile remains subdued.
To start, we will take an average of CASH position sizing from all of our models. This will come down to 72%, with a wide 85% - 35% allowed. Equity exposure stands at 16% on average, while on the treasury side models average 11.6%.
Automated Strategies


The Sigma Portfolio (Live)

Yesterday, we have added a starter position in AMD, in order to boost our exposure to large cap, technology and growth stocks. It is a starter position, which we are looking to expand. For the moment, quality large caps are the place to be, as they are the drivers of this recovery in stocks.
We would like to increase our bond portfolio duration as well, provided with the right entry point. There is simply too much bearishness in both the equity and treasuries markets currently. Gold is also a diversification option we would pick up on a dip.
When the time comes, we will switch up our position in SPY with more targeted single-name exposure. But given Horizon’s atrocious results over the past year, a more aggressive strategy is too risky at this point.