Portfolio Rebalance / May 22
Following the Signal Sigma Process
The approach to this article follows the step by step process described here. All visuals are sourced from various instruments available in the platform. If you are using the Portfolio Tracker, you’ll be able to see how we set it up for our own portfolio at the end of this article.
Last week, we took a laid back approach to our rebalancing process and did not perform any adjustments. As Q1 Earnings Season is drawing to a close, equity markets are grinding higher on the back of increased risk appetite, but low liquidity conditions. There are signs that the current rally is running out of steam and could use a slight pullback to support in order to reset buying conditions. All that’s needed is the right downside catalyst, and NVDA’s earnings might as well provide that. Even if Nvidia crushes earnings and estimates but fails to guide higher for the next quarter, that disappointment could send prices lower.
In any case, we’ll continue to follow our process and aim to reduce Consumer Discretionary (XLY) exposure for the quarter ahead.
Asset Class Allocation
The first step in determining optimal portfolio positioning is taking a look at the performance of the main asset classes, and determining which are suitable for investment. The Asset Class Overview Instrument gives us a clear macro picture.
All asset classes are investible.
SPY continues to trade in a bullish pattern, assuming our 1-year Price Target of $545 and 14% CAGR slope of the risk-reward channel. We will update our fundamental assumptions at the end of the month in order to keep this analysis pertinent.
There is immediate support at $514 - $521, where we assume a pullback is most likely to be met with buying interest. Notably, the rebound rally from late April is starting to lose steam, with the benchmark ETF being highly overbought (96/100).
We are still long UNG in the Sigma Portfolio, but nat gas is reaching some technical limitations after the 20%+ rally since we’ve included the position.

Gold (GLD) has consolidated around the 50-DMA / R2 level and promptly rebounded to new highs. In the last 200 trading days, GLD is the best performing asset class ETF, with around 25% returns, vs SPY’s 19%. We would be inclined to take profits here, as extensions from moving averages are unsustainable. Gold’s rally echoes the recent highs in cryptocurrencies, which are running on the same theory: that the government will print more and more fiat money and treasuries will sink as a result.
While the “printing” part is partially true (although misunderstood), our opinion is that inflation is heading DOWN, making TLT more attractive than GLD from a risk-reward perspective in the year ahead.
Long term treasuries (TLT) are at important juncture, from where significant upside or downside will be achieved (this is what we call a “pivot” area). It’s important for TLT to maintain the current rebound dynamics and close sustainably above the 200-DMA by Friday’s close in order for us to get more bullish on treasuries short-term. Investors are still apprehensive about treasuries and clearly prefer “inflation hedges” such as Gold for now.
Enterprise, our core investment strategy, maintains a similar allocation to last week, with minimal adjustments.
In terms of equity risk exposure, SPY is maintained at around 67%.
Bonds exposure (IEF) stays at 20.8%.
The position in GLD is slightly reduced, at 4.7% from 4.98%.
The position in DBC is also maintained at 2%.
Overall, Cash is slightly decreased, from 7% to 5.7%.
Since this model only trades 4 ETFs, we use it to judge overall portfolio positioning. The strategy’s risk profile is balanced, almost in line with its 60-40 benchmark. We agree with the model’s positioning.
2. Sector / Industry Selection
The next step in creating our portfolio positioning is to break down each broad asset class into more granular groups of assets. This will help us understand which pocket of the market is outperforming or underperforming and make our selection accordingly.
Since Equities are an investible asset class, we’ll take a look at how different Factors are performing and check for any notable opportunities.


We have included tables for this week and the prior 3 article editions in order to help you compare developments (click on the arrows or thumbnails to cycle through the tables).
As the recovery rally in the broad market has set fresh all-time-highs, it’s natural for individual factor ETFs to start registering positive medium term trends. Last week, only Emerging Markets (EEM) was on an up-trend. This week, the iShares Russell 2000 ETF (IWM), the Dow Jones Industrial Average (DIA) and Foreign Developed Markets (EFA) join EEM in setting positive trends. This tells us that we are currently in the middle of a transition.
Excepting EEM and Growth Stocks (IVW), there are no overbought ETFs in the short term. Notably, all of our benchmark factors are trading above all key moving averages.
Longer term, the Momentum Factor ETF (MTUM) appears unreasonably extended. However, when comparing its performance to SPY on a 2-year basis, MTUM has barely caught up in performance terms.

Among more granular Factor Returns, short term correlations are dominated by Share Buyback to FCF ratio. It’s no surprise that in the wake of Q1 Earnings Season, as AAPL and GOOG have dominated buyback announcements, to see this factor rank high up. AAPL has rallied 16% since announcing the biggest US buyback ever at $110B.
Longer term, we still find a quality factor like the Pietroski F-Score dominating rankings. But this is no longer high performing across all timeframes for the moment. In fact, there is now not a single factor to highlight for all time periods, as performance appears to be truly mixed among various styles of stocks.

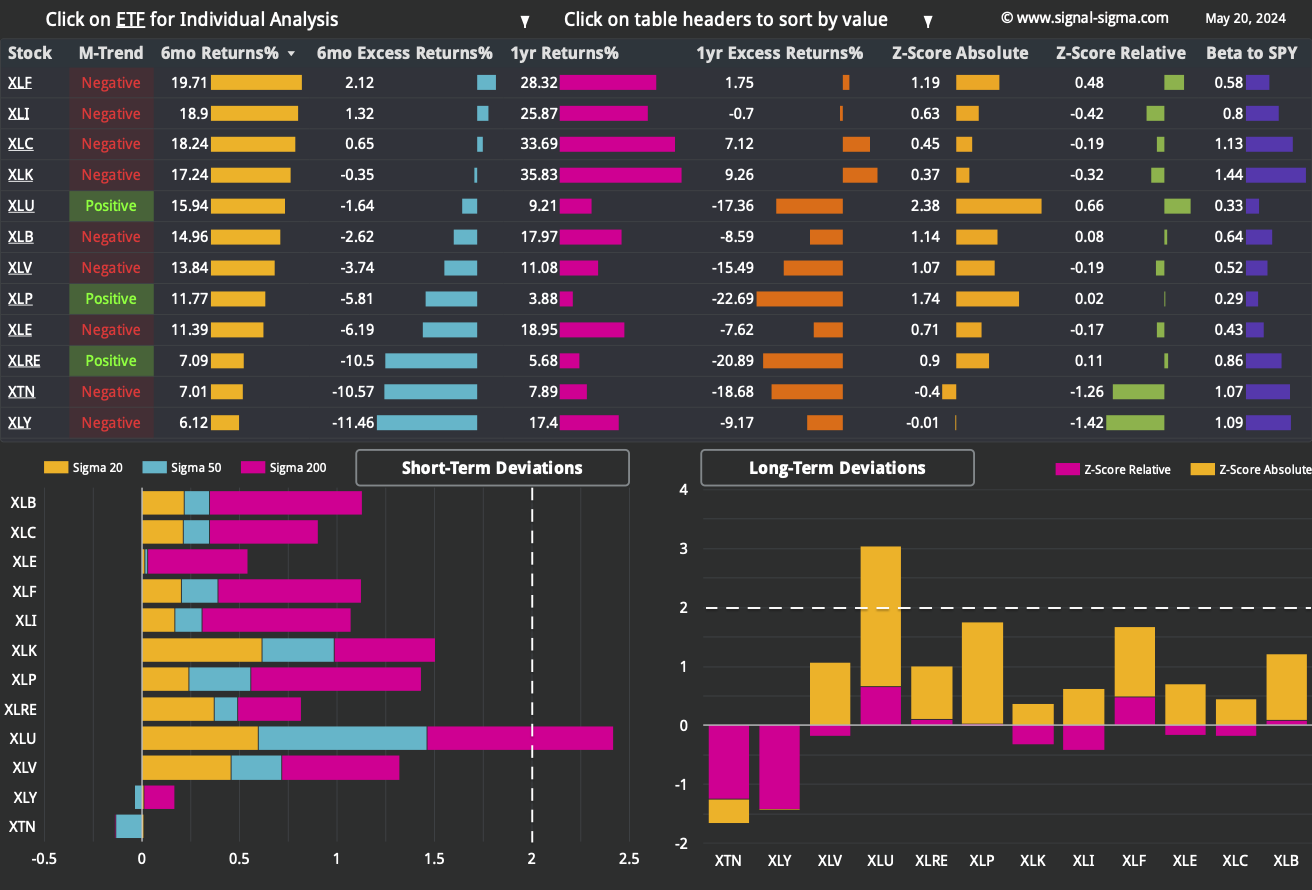
Here’s how we stand on the Sectors front:


We have included 3 former tables from previous articles, for your convenience.
This week, the rally in Utilities (XLU) has continued unabated. Besides the technical “breakout” pattern, the same fundamentals are driving the gains in XLU as Nat Gas (UNG). There is extra demand projected to come from EV charging stations and AI data centers in the future. Heavy investment in infrastructure will undoubtedly be required, while Nat Gas (which is close to 30-year lows) powers 43% of electricity generation in the US. Some of the increases are surely related to the broader inflation impacting the economy. However, as the graph denotes, some are due to incremental demand from AI data centers and EVs.
Defensive sectors Staples (XLP) and Real Estate (XLRE) have turned up on medium term trend, but are nowhere near overbought in the long or short term. Other sectors ETFs are trading within normal ranges.
Notably, Consumer Discretionary (XLY) is losing momentum, especially on a relative-to-SPY basis (right-lower panel). The overhang from the weak April Retail Sales report last week is still being felt. We will do our best to avoid high exposure to this sector in the coming quarter.

Nostromo has not traded since last week, maintaining a risk-on allocation.
It is currently planning to sell all holdings in favor of a simple SPY + TLT composition.
However, no trading shall be done until the appropriate signals are triggered. Of course, as long as the market remains bullish, SELL signals won’t register for current holdings. And since SPY is already on a BUY signal, a positive crossover can’t happen, unless we get selling pressure first.
Conclusion: it’s unlikely to see any trades in Nostromo for the week ahead - at least not on the equities side.
While underperforming in real life, this quirky model has its uses as a decision support tool. It’s also illustrative to understand why underperformance can also stem from under-allocation and “waiting for the right time”. If that time never comes, the opportunity cost is hard to make up.
3. Individual Stock Selection

Millennium Alpha has now completely rebounded from the April drawdown, and has set fresh all time highs. The factor correlation of its portfolio leaning hard toward Momentum Factor correlated names (MTUM). On the sectors side, Industrials (XLI) correlation is the highest, but there is no similar concentration as on the factors side. Exposure in terms of sectors is more evenly distributed among Tech (XLK), Communications (XLC) and Healthcare (XLV).
Similar to our discretionary analysis, this system is least correlated to Consumer Discretionary (XLY) names, with the sole company representative of the sector being Chipotle Mexican Grill (CMG).
As per usual, you can tweak this system using your own inputs if you wish.
4. Market Environment
The next step in our process is to take into account the type of market environment that we are currently trading in. For these purposes we use the Market Internals and the Market Fundamentals Instruments. Comments on the overall state of the market can usually be found in our Weekly Preview Article.
The number of stocks above their 20 and 50 day moving averages has rebounded, but not to the extent that we would have liked to see. There is a certain bearish divergence forming between the highs established previously in the rally and the peaks for stocks trading above their 20 and 50 DMAs. While the number of stocks trading above their 200-DMAs is fine, our interpretation is that the market looks tired right now.
Neutral Signal in Stocks trading above their 200-day Moving Averages
As a contrarian indicator, sentiment works best near extremes. At this juncture, we can describe sentiment as “Neutral”. Note the same “lower lows” pattern forming in sentiment as well, echoing the chart above. It’s counterintuitive to talk about ever decreasing optimism, with markets near all-time-highs, yet here we are!
Neutral Signal in Sentiment
The comparison of Z-Scores reveals the disparity between large cap performance (SPY) and the top 1000 stocks by dollar volume (the broad market), equally weighted.
The Z-Score divergence has increased since last week, in a sign that mega-caps are rebounding relative to their smaller peers. We would expect, eventually, for smaller cap companies to start leading again. The recent trend is taking a pause, but overall there are no issues with this indicator.
Bullish Signal in Market Internals Z-Score
Dollar Transaction Volume remains anemic, as current prices are not attracting a lot of buyers (or sellers) to the market. This creates an environment with less liquidity, which is not supportive of a further rally at this point. Instead, the market is vulnerable to “air pockets”, where reduced liquidity may exacerbate volatility coupled with the right catalyst.
Bearish Signal in Dollar Transaction Volume

5. Trading in the Sigma Portfolio (Live)
After reviewing all of the above factors, it’s time to decide on the actual investing strategy for our real-life portfolio.
Automated models are strongly allocated to risk at this juncture. We’ll maintain a more balanced approach for now, and look for a better opportunity to increase equity risk exposure when the market pulls back to support.
In the meantime, we are executing a position swap, based on correlation technicals.
Automated Strategies and Market Outlooks

The Sigma Portfolio (Live)
In the Sigma Portfolio, we’ve been holding a rather large placeholder position in the guise of IWM (iShares Russell 2000 ETF). This position has the highest correlation with Consumer Discretionary (XLY), so it needs to be reduced. Instead, we have used the Millennium Alpha Ranking System to screen for 2 stocks which fit the correlation requirements and also have great fundamentals and appreciation potential: MPLX LP (MPLX) and Colgate-Palmolive Company (CL).
We are executing the following orders at today’s close:
SELL 50% IWM (Reduce position to 4% of NAV)
BUY 2% MPLX (Initiate a 2% position)
BUY 2% CL (Initiate a 2% position)
Click here to access our own tracker for the Sigma Portfolio and understand how the positions contribute to the overall exposure profile. We’ve been adding to risk as well as tech and momentum exposure with the latest trades.
In total, we stand to gain $15.272 by risking $10.862 if our targets are correct. The risk-reward ratio is not great right now, but that does not mean we should not be allocated to risk at all.
In terms of Factor correlations, exposure is well balanced. Very little needs to be done in this sense.
On the sectors side, we’ve decreased Consumer Discretionary (XLY) exposure significantly, courtesy of our latest trades. Depending on how the market evolves, we may adjust this further, as XLY is still the #4 sector exposure of our portfolio.
If you have any questions, please contact us using your favorite channel. Have a great week everyone, and happy investing!
Andrei Sota