Portfolio Rebalance / October 04
Following the Signal Sigma Process
The approach to this article follows the step by step process described here. All visuals are sourced from various instruments available in the platform. If you are using the Portfolio Tracker, you’ll be able to see how we set it up for our own portfolio at the end of this article.
Over the past week, equity markets have come under a decent amount of selling pressure. Given the stellar recent performance, a slight pullback is in no way surprising, especially since there have been plenty of excuses to sell on the geopolitical side.
Traders who were previously excited about the Fed’s rate cut prospects have had to contend with geopolitical tensions and some ho-hum economic reports. First of all, Jerome Powell reiterated his stance on future monetary easing, resetting market expectations. At one point the Fed Funds futures market was implying the Fed could cut rates by 100 bps in total by year end. Monday afternoon, in his speech at the NABE annual meeting on economic outlook, Mr. Powell used a more hawkish tone and reminded investors that the mid-September “dot plot” is still in play. This calls for an extra 50 bps of easing in 2024, not 100 bps.
The JOLTs report released on Tuesday has shown a relatively strong 8 million job openings. Under the hood, data continues to be weak, however. New hires and quit rates continue to decline, and both are well below pre-pandemic levels. The current labor situation looks like a stalemate: managers are not hiring, not firing and employees are not voluntarily quitting either.
Meanwhile, the longshoremen strike has been resolved just as swiftly as it started. The economic impact would have been modest in any case, so it was more of a headline making affair and nothing else.
Today’s jobs report, on the other hand, paints a hot economic picture. The US economy added 254K jobs in September 2024, much higher than an upwardly revised 159K in August, and well above forecasts of 140K. It is the strongest job growth in six months and higher than the average monthly gain of 203K over the prior 12 months. The headline unemployment rate fell to 4.1%, the lowest in 3 months. U6 Unemployment (the broader measure) also decreased to 7.7% from 7.9% in August.
We expect these figures to put a degree of selling pressure on the bond market but otherwise alleviate concerns of a broader economic slowdown and boost equities.
Finally, geopolitical tensions have flared up in the Middle East and caused oil prices to spike. As oil prices play a major role in inflation expectations, yields rose as well, depressing bond prices in the process. Safe haven bids moved to Gold and the US Dollar. For now, this is not a major issue, as oil prices are relatively well contained (cheap). However, if hostilities escalate to the point Iran’s supply is threatened, and oil jumps to $90 and above — watch out! Bonds and stocks might take a dive as a consequence - primarily on inflation fears.
That being said, let’s dive in to our usual process.
Asset Class Allocation
The first step in determining optimal portfolio positioning is taking a look at the performance of the main asset classes, and determining which are suitable for investment. The Asset Class Overview Instrument gives us a clear macro picture.
All major asset classes are investible this week.
Given the somber developments on the world stage and the bearish-sounding headlines in the last week, we would argue that the equity market has been rather resilient. SPY is down only -0.85% from its record high and remans well supported at recent highs ($563). A move to the upside ($599) requires a more convincing bullish catalyst.
Commodities (DBC) have experienced some significant volatility around our stop-loss level of $22.3. Finally, a breakout has registered, with oil and nat gas prices as the primary catalyst. While DBC is medium term overbought (98 / 100) oil does not look expensive at around $73 / bbl, so there is definitely the scope for more upside.

Bullish prices beget more bullish prices in Gold (GLD), but the yellow metal’s ascent has approached a technical limit for now (the 1 standard deviation upper trend-line). At this point, the Gold trade is a pure momentum play, with little fundamental underpinnings. However, as long as prices stay elevated, the potential for more gains are there.
The following graph published by Sentimentrader describes Gold’s previous correlation with the performance of other sectors. Turns out that whenever Gold hits multiple 52-week highs, Energy (XLE) performs best in the following year. Note that all sectors post a positive return in these instances, disproving the narrative that “high gold prices are bearish”.
TLT has further retraced into our “Buy Zone” but the support area at $97 - $99 has not held. Given today’s hot jobs print, there is scope for more downside in bonds. During the past week, increased oil prices have also translated into increased yields across the treasury curve on inflation revival fears. The trade has depressed bonds, offering savvy investors a great entry point. We do need to wait for a valid reversal signal at this juncture, since technical downside is large to $92.
Enterprise, our core investment strategy, has slightly trimmed equity exposure this week in favor of a much larger allocation to bonds.
Stocks exposure via SPY is slightly lower, at 70% today, compared to 79% last week.
Bonds exposure (IEF) has increased, from 11% last week to 25% today.
The position in GLD has been reopened, at 3%.
Commodities had not been investible at the start of the week, so they were excluded from the allocation.
Since this model only trades 4 ETFs, we use it to judge overall portfolio positioning. Enterprise is now closer to a more balanced approach, but cash levels remain low (2.7%).
2. Sector / Industry Selection
The next step in creating our portfolio positioning is to break down each broad asset class into more granular groups of assets. This will help us understand which pocket of the market is outperforming or underperforming and make our selection accordingly.
Since Equities are an investible asset class, we’ll take a look at how different Factors are performing and check for any notable opportunities.


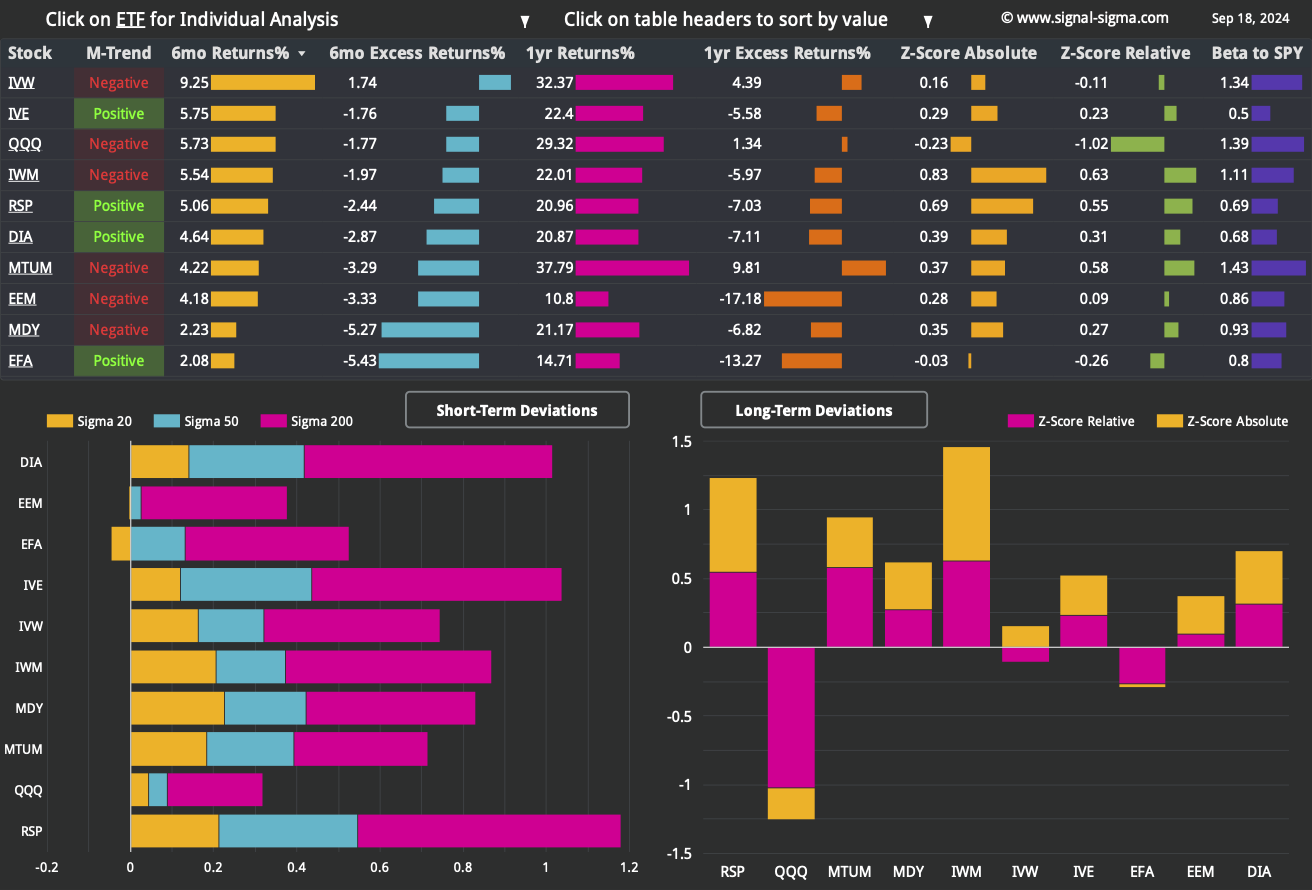

We have included tables for this week and the prior 3 article editions in order to help you compare developments (click on the arrows or thumbnails to cycle through the tables).
Given the bazooka stimulus measures that Chinese authorities have decided to unleash upon the economy, it’s no surprise to see the Emerging Markets ETF (EEM) post one of the most extreme short term deviations we have ever recorded (a score of 3 is the maximum possible on our scale). EEM has now jumped to the top of the leaderboard in terms of 6 month absolute and relative returns, as well as absolute and relative Z-Scores. To keep matters in perspective, the 2 standard deviation extension from the median trendline puts this ETF in a clear breakout pattern.
Despite the rise, EEM is trading some -20% below its all-time-high established in early 2021.


Besides this observation, we also note a positive breadth backdrop, featuring all of the factors trading above the key moving averages and in positive medium term trends. Most factors are also outperforming SPY in the long term, another piece of great news from a breadth perspective. The sole relative underperformer remains the Nasdaq (QQQ).
Among more granular Factor Returns, it’s hard to find a common thread with metrics in the short term. We can single out the fair performance associated with a high Current Ratio, as companies with the means to pay off short-term liabilities have been favored by investors.
Companies with a high Pietroski F-Score have performed well at both the long and the short timeframes.
Here’s how we stand from a Sectors standpoint:


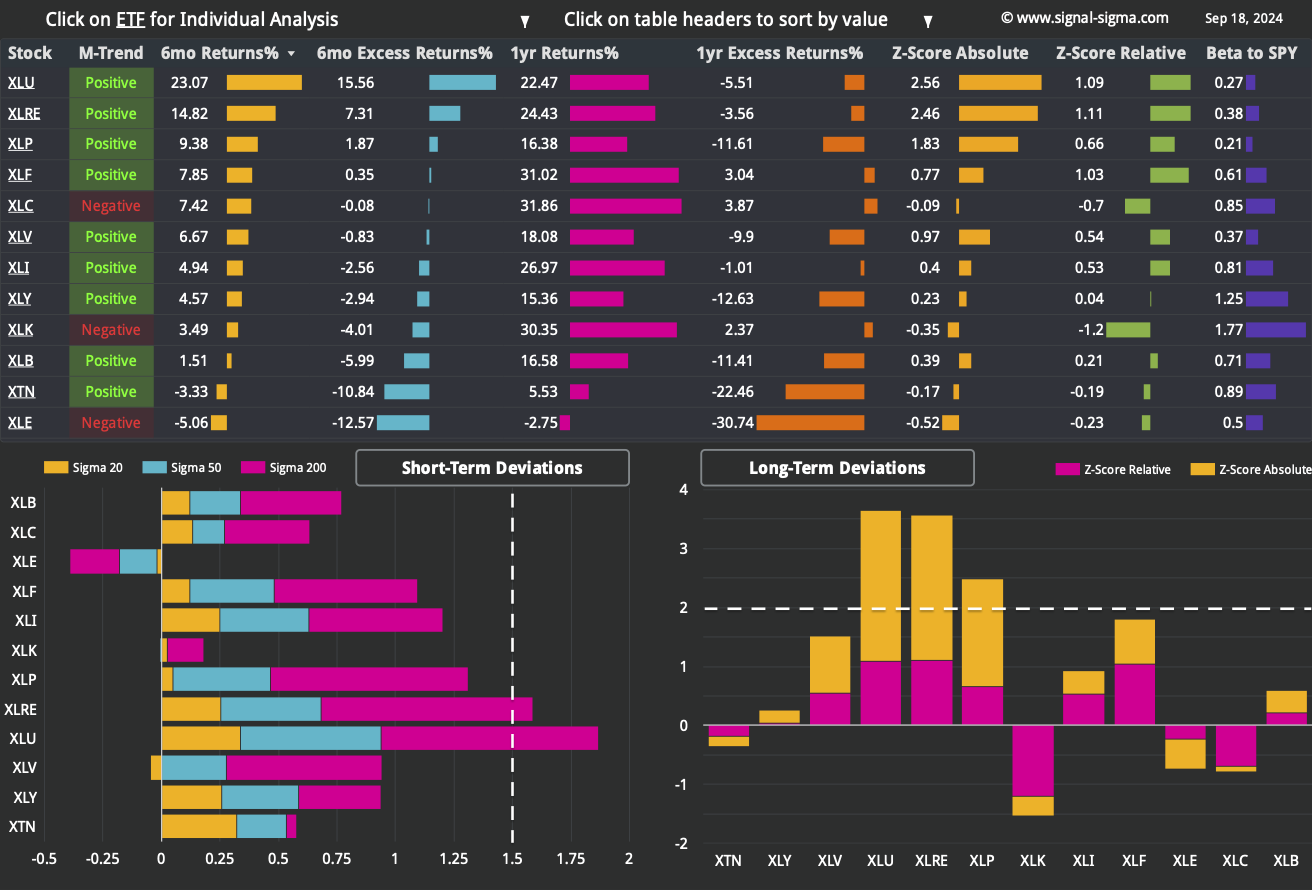

We have included 3 former tables from previous articles, for your convenience.
The Sectors dashboard looks broadly bullish, with most ETFs registering a positive medium term trend and trading above all of the key moving averages. Last week, Energy (XLE) was severely underperforming, but that’s no longer the case today following the spike in oil prices.
Utilities (XLU) are still leading the current rally, but other defensive sectors have slipped. For instance, Staples (XLP) are no longer overbought in the long and short term, while Healthcare (XLV) is under a bit of pressure and trading below the 20 and the 50 DMAs. In fact, the only 3 sector ETFs trading below their 20-DMAs are all defensives (XLP, XLRE and XLV), suggesting a loss of momentum.
This may be interpreted as a subtle sign investors are rotating to risk-on areas of the market. High beta sectors Tech (XLK) and Consumer Discretionary (XLY) are nowhere near overbought at the moment.
Technically, Healthcare (XLV) is offering a good “buy the dip” opportunity, although investors need to wait for a valid reversal signal. As it stands right now, XLV is in a precarious situation, with support at $152 (R1) giving way. Downside stands at $148 (M-Trend).
After ripping higher +11% in the past 3 months and beating every benchmark, Nostromo is now almost flat. The ~30% position in Momentum Factor ETF (MTUM) has been sold on Wednesday.
The slight short position displayed is a rebalancing artefact used to hedge a previous equity position — but it is not meaningful for our analysis and interpretation.
On the contrary, Nostromo will buy SPY on the next BUY signal and also buy TLT in size whenever the ETF turns up.
In summary, Nostromo will remain flat until a tactical opportunity re-emerges.
3. Individual Stock Selection

Millennium Alpha continues to perform well in 2024. Our top stock-picking system is closing in on +40% year-to-date live performance. Having refreshed the portfolio last week, there are only minor changes to position sizing at this week’s rebalancing.
Primary factor correlation is heavily tilting towards the Momentum ETF (MTUM) as well as Growth Stocks (IVW). On the sectors side, Tech (XLK) and Industrials (XLI) make up the majority of exposure.
The Vol Target flavour of Millennium is also performing equally well on a risk-adjusted basis. Its portfolio composition leans more toward Value Stocks (IVE), Energy (XLE) and Financials (XLF).
Millennium Momentum has also recently caught up and exceeded its benchmark (MTUM). Its portfolio has no overlap with either Alpha or Vol Target and leans primarily toward small caps (IWM) and Industrials (XLI).
4. Market Environment
The next step in our process is to take into account the type of market environment that we are currently trading in. For these purposes we use the Market Internals and the Market Fundamentals Instruments. Comments on the overall state of the market can usually be found in our Weekly Preview Article.
Market breadth has retraced somewhat from previous highs, but proves resilient. With more than 70% of broad market constituents trading above their respective 200-DMAs, no bearish argument can be made. This market has strong participation.
Bullish Signal in Stocks trading above their 200-day Moving Averages
As a contrarian indicator, sentiment works best near extremes. The current reading (62/100) signals “Greed”.
Sentiment took a hit in the past week due to numerous negative headlines — basically most of the points we made in the intro: geopolitical tensions, a more hawkish Fed than priced in, lukewarm economic readings — all with markets near all-time-highs. It’s understandable hard for investors to be optimistic given this backdrop.
Neutral Signal in Sentiment
The comparison of Z-Scores reveals the disparity between large cap performance (SPY) and the top 1000 stocks by dollar volume (the broad market), equally weighted.
Ever since early August, mid-caps and large caps have performed equally well. As can be seen in the graph, extensions for SPY have been lower and lower, following 2 major bouts of over-performance. What is important to note here is that the broad market has not “caved in” under selling pressure whenever the large caps pulled back. Sure, there has been some correlated selling on downturns, but overall, the broad market remains resilient and that is bullish.
Bullish Signal in Market Internals Z-Score
Dollar Transaction Volume is trending lower again, as investors are not bothered to chase the rally further for now. The most recent volume value is low enough to spark worries that insufficient liquidity can limit the current advance.
Bearish Signal in Dollar Transaction Volume

5. Trading in the Sigma Portfolio (Live)
After reviewing all of the above factors, it’s time to decide on the actual investing strategy for our real-life portfolio.
The market is in consolidation mode at the moment. There is no obvious reason to increase or decrease exposure at this juncture. We are watching bonds for a reversal signal, as well as oil for a “topping” signal.
Healthcare (XLV) is on its way to providing a good entry point, but other than that, it’s mostly “wait and see” this week. The plan in October is to eventually increase equity exposure before the elections, but we’ll do so gradually starting next week.
Automated Strategies and Market Outlooks

The Sigma Portfolio (Live)
There are no trades scheduled for today.
Click here to access our own tracker for the Sigma Portfolio and review how each position contributes to the overall exposure profile.
In total, we stand to gain $18.631 by risking $9.772 if our targets are correct. The risk-reward equation is good, as for each $1 of potential risk, we stand to gain almost $2. Notably, almost half of potential upside is provided by treasuries, not equities.