Portfolio Rebalance / September 14
Following the Signal Sigma Process
The approach to this article follows the step by step process described here. All visuals are sourced from various instruments available in the platform.
Our strategies are going all-in, using significant leverage in mid-September. As long as a general market downturn does not occur, there is no reason for exposure to come down, as conditions are percieved to be “safe”, and volatility should work in our favor. The idea behind selectively using leverage in an active strategy is to mitigate the low (and sometimes zero) portfolio fluctuation when exposure is reduced.
E.g.: when a strategy benchmarked to an “always-invested” index (like the S&P500) takes you completely to cash for 6 months, it needs to compensate for the lost exposure in the following 6 months, in order to compete with the benchmark on equal terms. It needs a 2X leverage ratio for the rest of the year.
Asset Class Allocation
The first step in determining optimal portfolio positioning is taking a look at the performance of the main asset classes, and determining which are suitable for investment. The Asset Class Overview Instrument gives us a clear macro picture.

All major asset classes are investible at present; Commodities are notable for the recent breakout, Treasuries are holding on to support, despite the recent pullback; Equities and Gold are completing a consolidation pattern;
SPY remains on the expensive side of the technical range, closing at $445, between $449 Resistance and $431 Support. The benchmark ETF is neither overbought, nor oversold, and looks primed for the next significant move in either direction. As September unfolds, some consolidation with a negative bias is expected from a seasonal point of view.

Great news for commodity bulls is bad news for everyone else. DBC, the benchmark ETF for commodities, has broken out of the recent trading range and is headed back up. Oil has been headlining the move, of course, with WTI nearing $90/barrel, amid OPEC production cuts and a half depleted U.S. SPR.
The market sees the short term impact from oil as inflationary, although we have previously shown it to be deflationary, on a longer time horizon.

Gold (sometimes treated as an alternative to equities by our system) is completing a months long consolidation process. Gold looks cheap to us at this stage, and further pressure taking the yellow metal into “Oversold” would be a good place to add exposure.

The U.S. Dollar is at the very high end of its trading range, clearly overbought (95/100) and losing momentum. Our systems are betting on multiple asset classes, using leverage. In effect, they are anticipating a short term drop in the U.S. Dollar, which would instantly benefit “everything else”.
The topping process in the MACD signal looks to confirm the positioning, for the moment.


Treasuries are holding on to support ($92.4) and have been lacking in performance recently. The current trend is unsustainable, however. Holders of long term treasuries cannot bear 20% / year in principal losses. While bonds are the most hated asset class right now, they also represent the best long-term opportunity for the patient investor. Contrary to stocks, bonds issued by the U.S. have a finite low value, since a credit based economy can’t survive on high interest rates. As bonds prices drop, yields move higher and constrict economic activity.
Sooner or later, the Fed will be forced to cut rates in order to mitigate the effects of their own monetary policy. At that point, bond prices are poised to spike, and return to all-time highs.

Enterprise, our core strategy, remains levered up 2X.

Enterprise, our most conservative model, is pursuing volatility at the moment, via exposure to 3 asset classes. In other words, the model is betting against the USD.
Since this model only trades 4 asset class ETFs, we use it to judge overall portfolio positioning.
Enterprise is looking to completely close its position in equities. It will sell SPY by next week, if the benchmark ETF registers a MACD SELL signal.
The strategy is looking to add to GLD on a suitable BUY signal, and mildly adjust the position in TLT.
Cash allocation is at negative 101%. This rather massive use of leverage is fully intentional and is meant to compensate for periods when the strategy is under allocated.
2. Sector / Industry Selection
The next step in creating our portfolio positioning is to break down each broad asset class into more granular groups of assets. This will help us understand which pocket of the market is outperforming or underperforming and make our selection accordingly.
Since Equities are an investible asset class, we’ll take a look at how different Factors are performing and check for any notable opportunities.


We have included tables for this week and the prior 3 weeks in order to help you compare developments (click on the arrows or thumbnails to cycle through the tables).
All factors except Momentum (MTUM) are on a negative Medium-Term Trend. This kind of alignment usually occurs near relative market extremes, since factors don’t normally trade together.
On a short term basis, iShares Russell 2000 ETF (IWM), Mid-Caps (MDY) and the Equally Weighted S&P500 (RSP) stand out as being oversold and trading below their 50-DMA. Meanwhile, Growth Stocks (IVW) and the Nasdaq (QQQ) continue to enjoy the highest deviations, despite the recent pullback.
The same ETFs (QQQ and IVW) are also extended on a longer term horizon. A positive development, longer term, is that all factors have a Z-Score above zero, on an absolute metric (measured against their own performance). This is a bullish hallmark of market participation, despite the large disparity in performance in the near term.
The iShares Russell 2000 ETF (IWM), is a factor that we closely follow for clues about market breadth. Starting in May 2022, IWM has traded in a well defined range up to the present day. For the rally to continue into year end, it becomes crucial for IWM to hold support at the S2 level (green line - $180), then challenge resistance at $193 and successfully break out.

According to our analysis, there is no tactical allocation opportunity present at the moment. The only outperforming factors, longer term (IVW, QQQ) have already bounced, and “the train has left the station” as an opportunity to get long here.
Here’s how we stand on the Sectors front:


We have included the last 3 weeks of tables as well, for your convenience.
On the Sectors side, there is a bit more variety than we’ve seen in Factors. Energy (XLE), Healthcare (XLV) and Financials (XLF) are trending positive in the medium term. While it makes sense for Healthcare to gain in a defensive environment, Energy and Financials present us with a surprise.
In the short term, several sectors are quite extended to the downside: Staples (XLP), Real Estate (XLRE) and Utilities (XLU), somewhat defensive in nature, are deviated well below every key moving averages. Transports (XTN) are also oversold in the short term, but are managing to hold out better above the 200-DMA. No sector is overbought.
On the longer term, laggards are still defensives Utilities (XLU ) and Staples (XLP). Topping the leaderboard are the highest beta sectors: Tech (XLK), Communications (XLC) and Consumer Discretionary (XLY).
We have been expecting a rotation from some time: from high beta to defensives. However, this has not arrived in the slightest. The only tactical opportunity present right now is in Energy (XLE), a sector high in momentum, but not nearly as extended longer term as Tech (XLK).

Nostromo, our tactical allocation model, is following a similar playbook to Enterprise. It is using significant leverage in order to gain exposure to 3 asset classes.
It is looking to sell QQQ and thus close exposure to all equities, on the next available SELL signal (most likely a negative MACD crossover).
It’s also looking to adjust bonds positioning, by reducing TLT and adding to TIP, IEI, LQD and MBB (less volatile ETFs). It is buying High Yield Corporate Bonds (HYG) at today’s close, and increasing treasury exposure.
Notably, Nostromo holds Silver Miners as a derivative play on Gold. It is also looking to buy Gold miners and physical silver on appropriate BUY signals.
Nostromo holds a negative 101% cash position, being 2X leveraged at the moment.
For more info about how Nostromo targets sectors or factors within a broader asset class, read this article. The first part sheds some light on the selection process going on in the background.
3. Individual Stock Selection
Energy has drawn our attention today, and the stock screener reflects that. We’re aiming to find various candidates for exposure to this sector. The screener has been set as follows:
Pietroski F-Score > 6 (ensures quality)
Operating Leverage > 1 (lean business model)
Quick Ratio > 0.5 (good financial position, given the field)
Z-Score Relative > 0 (outperforms benchmark)
Net Profit Margin > 5%
Primary Correlation: XLE
Rising Margins
The screener outputs the following 17 stocks:


Range Resources (RRC), Schlumberger NV (SLB) and Halliburton Company (HAL) look interesting to us. We can study their financials using the Fundamentals Explorer, and model their Price Target / EPS Growth Rate using the Valuation Wizard.

This week, we will spotlight the Millennium Alpha Smart Beta portfolio. Interestingly, tech related exposure has increased to second place, both on the sectors front (XLK) and on the factors plane (QQQ). Industrials (mostly correlated with mid-caps) still make up the majority of the portfolio, but a shift to higher beta stocks is evident.
In light of the recent RTX engine issues, we are looking for a replacement industrials-related position for the Sigma Portfolio. Alpha’s picks are noteworthy in this regard.

4. Market Environment
The next step in our process is to take into account the type of market environment that we are currently trading in. For these purposes we use the Market Internals and the Market Fundamentals Instruments. Comments on the overall state of the market can usually be found in our Weekly Preview Article.
From a moving average perspective, the equity market is “stuck” within the range established since November 2022. The recent pullback has stocks trading midway through this range, but there is no other notable observation at this juncture.
Neutral Signal in Stocks trading above their 200-day Moving Averages

As a contrarian indicator, sentiment works best near extremes. Right now, we are in the lower part of the sentiment band, with a “Fear” reading. This confers some confidence that increasing exposure at this juncture is not “wrong”, as it does not represent “chasing the markets”. However, if one is sufficiently allocated to risk assets already, there is no need to act now, as we are not in “Extreme Fear” yet.
Slightly Bullish Signal in Sentiment

In terms of Z-Score divergence, the SPY to broad market differential is persisting. This continues to betray market participants propensity to “hide” in liquid, large cap names, and avoid the risk of economically sensitive small and mid cap stocks.
Bearish Signal in Market Internals Z-Score

Transaction volume remains anemic. Market participants are content with their positioning.
Neutral Signal in Average Dollar Transaction Volume and Volatility

5. Trading in the Sigma Portfolio
After reviewing all of the above factors, it’s time to decide on the actual investing strategy for our real-life portfolio.
Our average system exposure is now almost 230% - automated models are betting on a continued bull run, and upward breakout in various asset classes, while Fear is the prevailing sentiment among participants.
Automated Strategies

The Sigma Portfolio (Live)

In The Sigma Portfolio, we are maintaining exposure to the same trio of asset classes (Equities, Gold and Treasuries), while being modestly leveraged. There is no need to make adjustments at this stage, but we will execute one trade in particular at today’s close:
SELL RTX (Close Position)
BUY 5% EXP (Initiate 5% Position)
RTX has violated our stop-loss level. After analyzing the engine powder coating issue, the lack of credibility of the management team is a major concern going forward. We will instead replace the position with EXP (Eagle Materials Inc), a similarly Industrials focused company selected from Millennium Alpha’s portfolio.
Using our Portfolio Tracker, we can determine our exact Sector / Factor exposure for the equities part of the allocation as seen below.
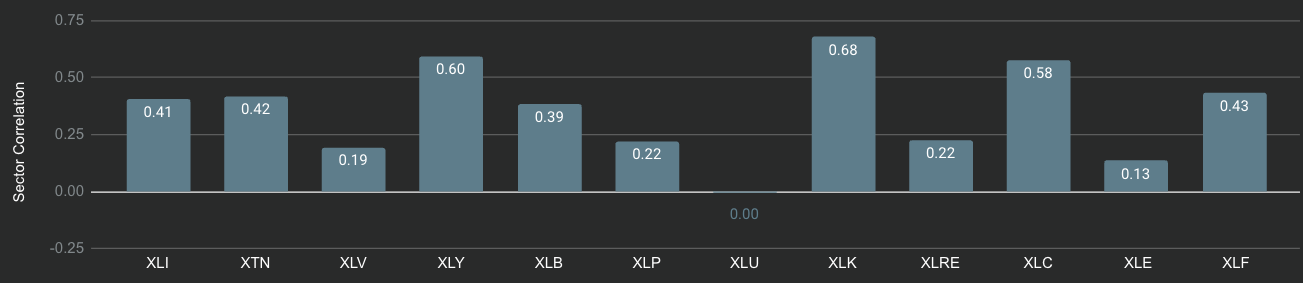
In terms of Factors, our trades have balanced out exposure as well.
You can access this correlation distribution for your portfolio as well by setting up the Portfolio Tracker.
