Portfolio Rebalance / September 19
Following the Signal Sigma Process
The approach to this article follows the step by step process described here. All visuals are sourced from various instruments available in the platform. If you are using the Portfolio Tracker, you’ll be able to see how we set it up for our own portfolio at the end of this article.
The day has (finally) arrived for the Fed to cut interest rates for the first time during this hiking cycle. Yesterday, the Federal Open Market Committee (FOMC) voted in favor of cutting the target range for the fed funds rate by 50 basis points to 4.75-5.00%. It was not a unanimous vote. Fed Governor Bowman preferred a 25-basis points rate cut, in a notable and uncommon dissent. To sum up:
“[the Committee] … gained greater confidence that inflation is moving sustainably toward 2 percent, and judges that the risks to achieving its employment and inflation goals are roughly in balance."
As such, the Summary of Economic Projections (SEP) is showing a shift in the median estimate for the 2024 unemployment rate to 4.4% (from 4.0% in June) and a downward shift in PCE inflation to 2.3% (from 2.6% in June) and core-PCE inflation to 2.6% (from 2.8%). Assumptions for GDP Growth in 2025 range from 1.3 to 2.5 (revised from 1.5 to 2.5 in June).
At this moment, the dot-plot shows a median estimate for 2024 of 4.40% that implies another 50 basis points of rate cuts this year and another 100 basis points in 2025. Despite this dovish outlook, treasuries sold off (especially at the long end) following the release, implying that this level of easing was mostly priced in. The other interpretation is that the Treasury market could be pricing in some inflation angst in a curve-steepening trade.
Finally, some commentators are suggesting that starting the easing cycle with a 50 basis point cut spells bad news (recession). The last 2 times the Fed started with a 50 basis point rate cut, the S&P 500 was lower by 15% and 22% over the next 6 and 12 months. However, this analysis only holds true going back to 1995. The assumption behind the bearish thesis is that the Fed is fighting some sort of downturn and cutting aggressively. We don’t believe that to be the case today.
Fed Chair Powell defended the larger, 50-basis points cut today as a proper "recalibration" to make sure the labor market and the economy remain in a solid condition and that the intent of yesterday’s move is to make sure they remain there. He also said that the Fed doesn't feel like it is behind the curve with its policy rate and that the larger cut can be construed as a sign of the Fed's commitment not to get behind.
Asset Class Allocation
The first step in determining optimal portfolio positioning is taking a look at the performance of the main asset classes, and determining which are suitable for investment. The Asset Class Overview Instrument gives us a clear macro picture.
All major asset classes remain investible this week, except Commodities.
Despite the -0.30% drop, SPY’s technical disposition is little changed, continuing to be well supported at $555, near the M-Trend level and 50-DMA. If former all time highs manage to be surpassed on a closing basis, it would not be surprising to see the benchmark ETF reach resistance at $590 (R1, +5.1%) in the medium term. A bearish technical outcome at this juncture would imply a break of support and the formation of a “triple top”; however, that’s not our base case assumption for the moment, as momentum appears to be strong.
Notably, the volatility of the VIX (VVIX) remains elevated. The current instance of an elevated VVIX alongside near-record highs suggests that investors are hedging more than is typical at market highs. Despite the positive momentum, investors are uneasy about the rally’s sustainability. Likely, the combination of the Fed starting to cut rates and the coming election are putting investors at unease, with the VVIX stubbornly printing above the key 100 level (note the April drawdown episode, where the VVIX immediately retreated from these values).
Commodities (DBC) have rebounded agressivley from last week’s extremely oversold reading. As long as there are recession fears on the horizon, translating into demand concerns, these types of moves look more like “dead cat bounces” and are not very tradeable. DBC also declined -0.64% following chair Powell’s press conference. Commodities remain uninvestible for the moment.
TLT has fallen just bellow support following yesterday’s Fed decision. As we have previously commented, everyone was already on-board with this trade going into the FOMC announcement. The fact that long term bonds declined (and yields rose) goes counter to the fact that the monetary policy rate was cut, and it is likely to get cut again (several times). Either these cuts were entirely priced in, or investors fear inflation will re-surface once again.
After the -1.24% selloff during the last hours of yesterday’s trading, TLT has reached its primary level of support at $99. We would be inclined to wait for a further retracement into the next level of support, at $97 (previous consolidation and trendline) before adding to this position.
Enterprise, our core investment strategy, has maintained its portfolio allocation nearly unchanged from last week.
Stocks exposure via SPY is slightly lower today, at 84% instead of 85% last week.
Bonds exposure (IEF) is maintained at 9%.
The position in GLD is maintained near 3%.
Commodities are uninvestible, so they are excluded from the allocation this week.
Since this model only trades 4 ETFs, we use it to judge overall portfolio positioning. The 84% stocks exposure in Enterprise remains very risk-on, almost at the upper limits of this model. The decision to overweight stocks to this extent is based on the stocks to bonds ratio, which dictates that at extremes, the reverse positioning should be implemented. This remains the case for now as well.

2. Sector / Industry Selection
The next step in creating our portfolio positioning is to break down each broad asset class into more granular groups of assets. This will help us understand which pocket of the market is outperforming or underperforming and make our selection accordingly.
Since Equities are an investible asset class, we’ll take a look at how different Factors are performing and check for any notable opportunities.


We have included tables for this week and the prior 3 article editions in order to help you compare developments (click on the arrows or thumbnails to cycle through the tables).
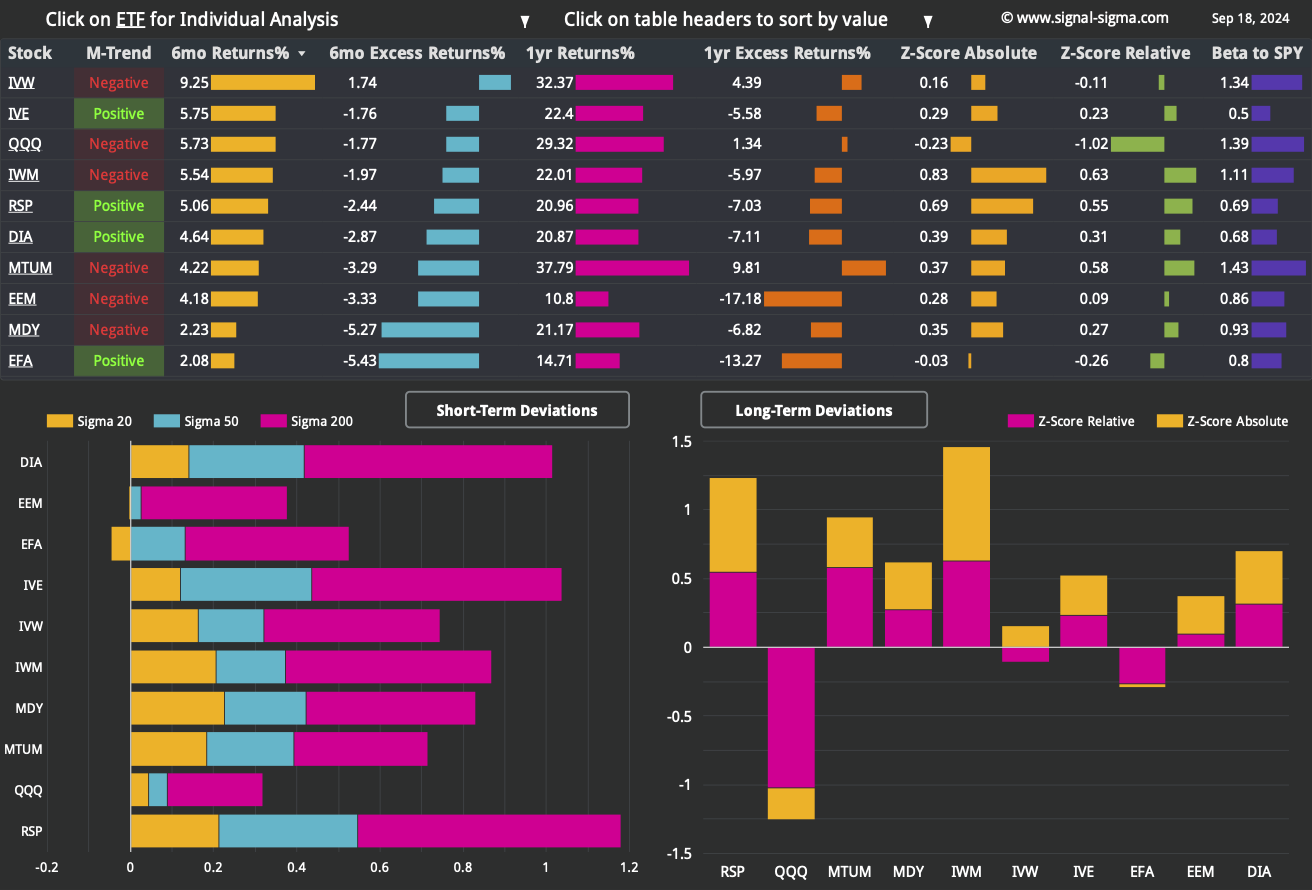
The factors leaderboard is showing a bullish change in momentum, with all components now registering positive 6-month returns and 4 out of 10 ETFs trading in a favorable medium term trend. There are no excesses in the short or long term, with factors neither overbought, nor oversold.
That being said, small caps — iShares Russell 2000 ETF (IWM) — are closest to becoming overbought longer term, but that is also due to a 2-year relative under-performance versus SPY (IWM is still trading -8.3% below its all-time record high). A recent series of higher lows and plenty of room to catch up keeps us bullish on smaller cap stocks, despite their heightened economic sensitivity.


Among more granular Factor Returns, stocks of corporations with higher debt loads have performed better in the short term. As yields are expected to go down, along with Fed rate cuts, servicing debt will become cheaper, helping the most indebted companies.
At longer timeframes, we find a well known quality factor becoming associated with out-performance — the Piotroski F-Score. Interestingly, these quality companies are currently lagging, as the factor is among the least popular at the 1 and 2 week mark, but near the top at the 1 and 2 year intervals. This can translate into a buying opportunity for stocks with a high Piotroski F-Score.
Here’s how we stand from a Sectors standpoint:


We have included 3 former tables from previous articles, for your convenience.
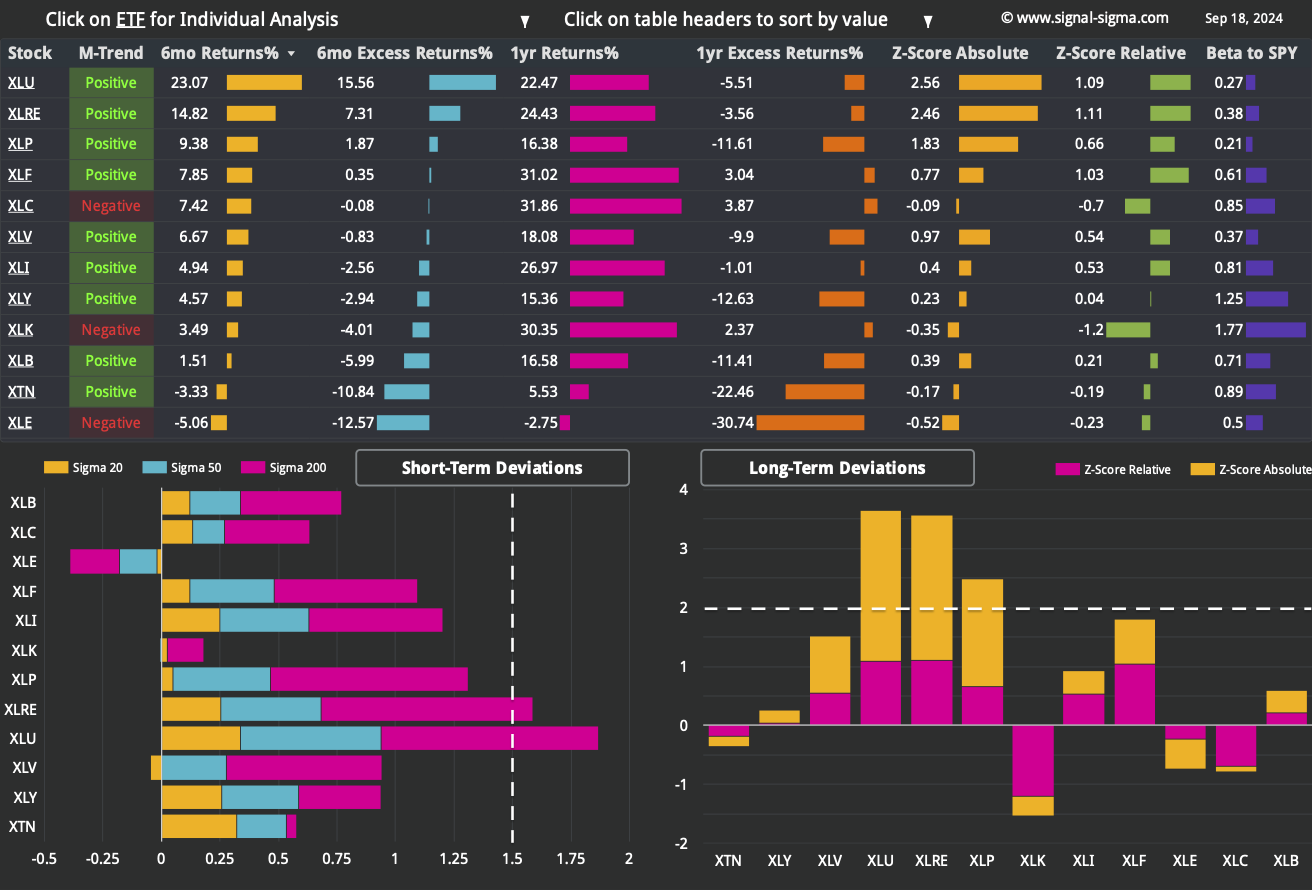
A glance at the sectors dashboard reveals that most ETFs (9 out of 12) are trading in a positive medium term trend, signalling a turnaround in momentum from a market breadth perspective. With the exception of Transports (XTN) and Energy (XLE) all other sector ETFs are registering positive 6 month and 1 year absolute returns, in another very good indication for the broad market.
Some defensive sectors continue to be overbought in the short and long term, notably Real Estate (XLRE) and Utilities (XLU). Staples (XLP) and Healthcare (XLV) have pulled back somewhat since we last ran this analysis, while Energy (XLE) is showing a much improved disposition, having bounced back from extremely oversold conditions.
With an absolute Z-Score of -0.52, Energy (XLE) is showing the best risk-reward ratio out of all ETFs.

Nostromo is dumping bonds at today’s close, following a negative MACD crossover on TLT. Moreover, our tactical allocation model has no plans to re-initiate a position in any treasury ETF.
The only equity position in Nostromo’s portfolio is the Momentum Factor ETF (MTUM), at 31% weight. SPY will also be bought on a positive MACD crossover, though that is unlikely to happen soon, as the signal is already positive.
The interesting part is Nostromo’s plan to buy Gold. Lots of it. The planned position in GLD would completely replace the previous allocation to bonds.
Swapping bonds for gold is a powerful allocation statement. One to keep an eye on, for sure.
3. Individual Stock Selection

Millennium Alpha has performed better during the past week, having closed the gap with its SPY benchmark, at the 3 month mark. The model is now just 2% off its high watermark.
From a factors correlation perspective, the portfolio carries Momentum and Value exposure primarily. This is echoed in the sectors correlation as well, with exposure toward Industrials (XLI) and Staples (XLP). Growth Stocks (IVW) and Tech (XLK) are also represented among major themes.
4. Market Environment
The next step in our process is to take into account the type of market environment that we are currently trading in. For these purposes we use the Market Internals and the Market Fundamentals Instruments. Comments on the overall state of the market can usually be found in our Weekly Preview Article.
Market breadth has turned up during the past week. Levels are consistent with a positive trending market, without being overbought. This is bullish.
Bullish Signal in Stocks trading above their 200-day Moving Averages
As a contrarian indicator, sentiment works best near extremes. The current reading (65/100) signals “Greed”, although this is not extreme just yet. It is expected that in the event of a breakout to all time highs, this indicator will trend toward the upper part of the range. However, that is just the nature of breakouts in general, and wouldn’t be too concerning for the moment.
Neutral Signal in Sentiment
The comparison of Z-Scores reveals the disparity between large cap performance (SPY) and the top 1000 stocks by dollar volume (the broad market), equally weighted.
Since June 2023, the longer term trend for this divergence had favored small caps. The differential has turned almost neutral since July 2024, with large caps unable to advance more than small caps did. This is bullish overall, showing that “a rising tide lifts all boats”. Another Wall Street axiom says that markets are strongest when they are broad — and that is the case today.
Bullish Signal in Market Internals Z-Score
Among market breadth indicators, Dollar Transaction Volume is the only “bearish” one. It looks like investors are disinterested in trading at higher prices, indicating a fundamental distrust in the rally. Furthermore, a lack of liquidity is problematic for price stability — potentially underscoring a fragile market. As shown in the chart below, transaction volume fell as market prices rose. This is bearish.
Bearish Signal in Dollar Transaction Volume

5. Trading in the Sigma Portfolio (Live)
After reviewing all of the above factors, it’s time to decide on the actual investing strategy for our real-life portfolio.
With the allocation in our live portfolio already at target, there’s little to do for the moment. We’ll wait until next week to see how the market ultimately reacts to the Fed’s 50 bps cut, then decide on further trades.
There are a couple of themes which have caught our attention:
Gold’s rise as a momentum trade, and Nostromo’s preference for it
A good risk / reward in Energy (XLE)
Transaction Volume and VVIX not confirming the current rally
Rotation from bonds back into stocks
We’ll see how these play out in real life, and simply follow the trend when it becomes clear.
Automated Strategies and Market Outlooks

The Sigma Portfolio (Live)
There are no adjustments to be made this week in our live portfolio.
Click here to access our own tracker for the Sigma Portfolio and understand how the positions contribute to the overall exposure profile.
In total, we stand to gain $15.318 by risking $7.913 if our targets are correct. The risk-reward equation is good, as for each $1 of potential risk, we stand to gain almost $2.
Among sectors, we are underweighting defensive sectors (XLU, XLP, XLRE) in favor of Industrials (XLI), Communications (XLC) and Tech (XLK). We are looking to add to Energy (XLE).
If you have any questions, please contact us using your favorite channel. Have a great week everyone, and happy investing!
Andrei Sota