Portfolio Rebalance / September 26
Following the Signal Sigma Process
The approach to this article follows the step by step process described here. All visuals are sourced from various instruments available in the platform. If you are using the Portfolio Tracker, you’ll be able to see how we set it up for our own portfolio at the end of this article.
With equity markets breaking out to all time highs, momentum signals have turned bullish both in the short and medium term. Several types of analysis we have published from various data sources corroborate the idea that we are trading in the optimistic “Scenario A” as defined in our latest Market Outlook research piece. This is based on the assumption that the economy will not enter a recession in the coming year, and EPS growth will accelerate, leaving around +17% of upside for the S&P 500 from current prices.
Carson Investment Research released a table showing how Fed rate cuts near all-time highs affect stock market returns. It turns out that in 100% of prior instances when the Fed has cut rates with equities near record values, stocks were higher 12 months later, with average performance of +13.9%.
The difference in returns is whether there was a recession or not. For now, we are seeing a bullishly biased market, holding a confirmed breakout above the July-August consolidation range, with the Yen Carry Trade blowup now a distant and non-concerning memory.
Another recent example of a bullish technical signal was indicated by a weekly reversal pattern: whenever a +3% rally followed a -3% decline as the S&P 500 was within 3% of its 52-wk high, the 12-month return in 90% of cases was positive, with an average performance of 16.2%. This triggered on September 13.
Analysts are raising their year-end price targets further after earlier predictions from this year fell significantly short. There is an expectation that year-over-year earnings growth will reach 18% by the end of 2025, which would justify much higher price targets, similar to what we’ve set in our own analysis. In the latest update, Goldman Sachs has pushed their Q3 economic growth estimate to 3%.
As is always the case, all of these projections can be subject to heavy revisions, especially if growth fails to materialize. However, the investing background at the moment is undeniably bullish and equity markets are not (yet) euphorically overbought.
Asset Class Allocation
The first step in determining optimal portfolio positioning is taking a look at the performance of the main asset classes, and determining which are suitable for investment. The Asset Class Overview Instrument gives us a clear macro picture.
All major asset classes are investible this week, including Commodities.
Bullish sentiment builds, as SPY racks up fresh records. The MACD BUY signal remains intact in both the short and the medium term. Longer term, the benchmark equities ETF is not overbought when considering a $672 1-yr Price Target. However, upside may be harder to come by given the large extensions above the 50 and the 200 day moving averages. We expect more grinding action with an upside bias. Potential volatility looms in October, as the election approaches and Q3 Earnings Season begins.
One of the alternate indicators that we were watching was the VVIX (Volatility of the VIX). Values below 100 are considered “safe” for long positioning. At the moment, the reading is 91, confirming the prevailing bullish trend -- while also telling us that the market is not entirely complacent.
Commodities (DBC) have continued the aggressive rebound this week, edging past our “Stop Loss” mark at $22.6. If this level holds by next week, expect commodities to re-enter the allocation of our automated portfolios.
Gold’s (GLD) has gone parabolic in the last week. Support has now been confirmed at around $233, while strong resistance is encountered at $247. For now, supply and demand conditions are extremely overbought, so we expect a consolidation should occur in the current range.
Amazingly, Gold has been strongly correlated with equities, acting as a pure momentum play. GLD outperformed SPY by 8% during the last 200 trading days (since Dec’23).
TLT has retraced into our “Buy Zone” support area, between $97 and $99, despite the recent Fed rate cut. This means that yields are up, in a counterintuitive fashion that has 2 connotations: either investors are selling bonds under the assumptions that rate cuts will stoke inflation, or this was a “sell the news” type event, where supply momentarily swamped demand and caused a fall in prices.
Either way, treasuries should perform well and provide an adequate hedge for a stock portfolio in the year ahead.
Enterprise, our core investment strategy, has sold Gold and slightly trimmed equities this week.
Stocks exposure via SPY is slightly lower, at 79% today, compared to 84% last week.
Bonds exposure (IEF) is slightly increased, from 9% last week to 11% today.
The position in GLD has been closed, due to overbought conditions.
Commodities had not been investible at the start of the week, so they were excluded from the allocation.
Since this model only trades 4 ETFs, we use it to judge overall portfolio positioning. This remains close to maximum risk-on, despite the slightly elevated cash levels (10%).
2. Sector / Industry Selection
The next step in creating our portfolio positioning is to break down each broad asset class into more granular groups of assets. This will help us understand which pocket of the market is outperforming or underperforming and make our selection accordingly.
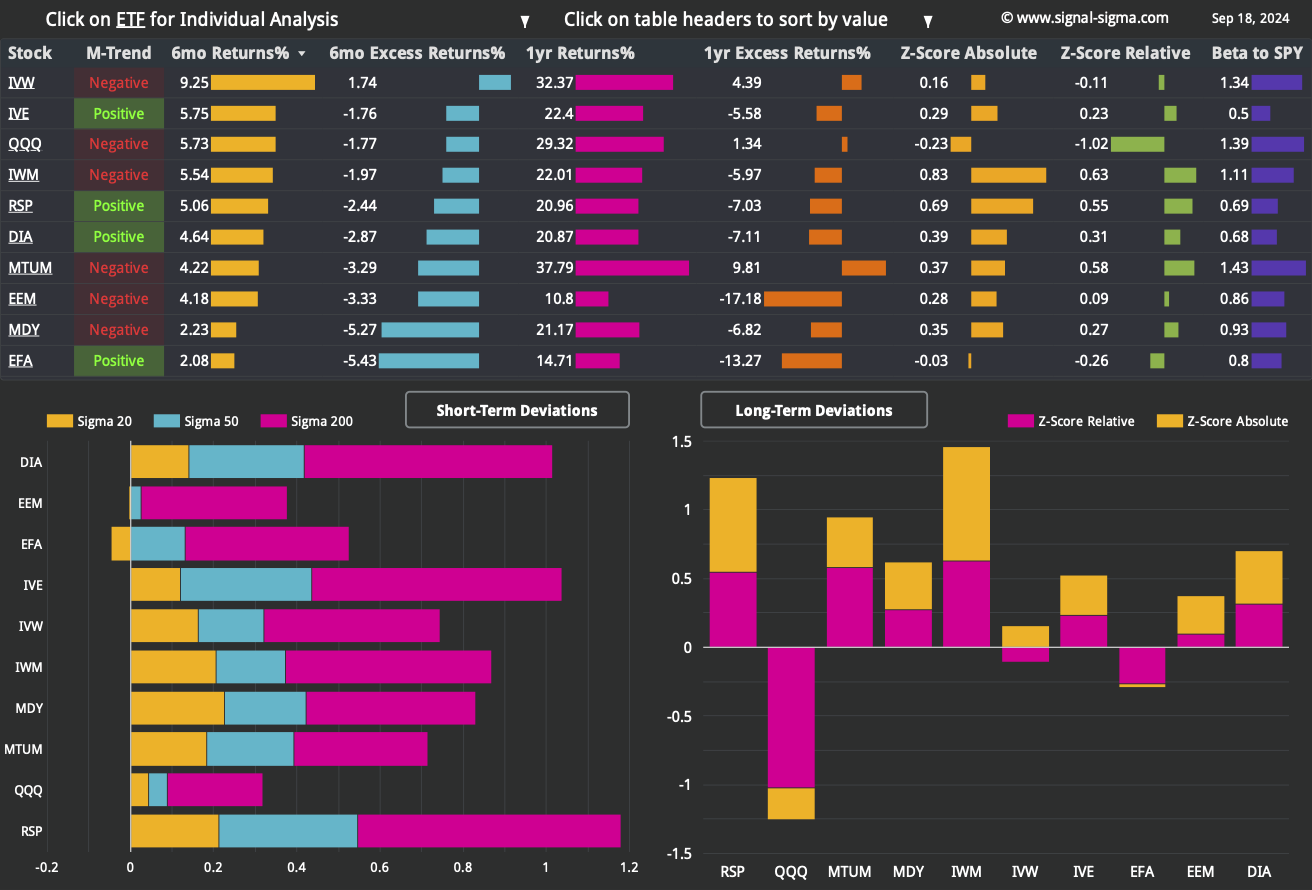
Since Equities are an investible asset class, we’ll take a look at how different Factors are performing and check for any notable opportunities.


We have included tables for this week and the prior 3 article editions in order to help you compare developments (click on the arrows or thumbnails to cycle through the tables).
We get a very bullish looking disposition when glancing at the factors leaderboard. All ETFs are now registering a positive medium term trend, a set-up we have last seen in early February this year. Additionally, all factors are trading above all key averages. In the near term, this translated into a +5% gain for the S&P 500 in the following month, as it signals strong market breadth.
There are a couple of overbought factors in the short term, most notably Emerging Markets (EEM), Growth Stocks (IVW) and Momentum Factor ETF (MTUM). There are no oversold factors.
Longer term, Momentum Factor ETF (MTUM) stands out for relative strength versus SPY, while Nasdaq (QQQ) is the laggard in this regard. On that note, the relative performance differential of small caps (IWM) to SPY is also quite large. This has largely come by as a result of an earnings growth divergence in the past 2 years: large companies have been able to tap the bond market for liquidity at meager rates in 2020 and 2021, thus being insulated from the Fed’s hiking campaign. In contrast, smaller companies usually borrow using floating-rate debt, which resulted in a higher interest expense. Therefore, in the coming year (assuming rate cuts materialize), these companies should see lower interest rate expenses and higher profit margins as rates decline.
It may as well be that the best investment idea for the next year are smaller capitalization companies, with relatively high debt loads, from the technology space.

Among more granular Factor Returns, a high Gross Profit margin has been most correlated with high returns, despite this factor ranking almost dead last at the 3 month mark.
As we had been speculating last week, companies with a high Pietroski F-Score have seen a resurgence in the near term. This is one of the top performing factors at the 1 and 2 year historical windows, but there’s been some weakness at the 3 and 6 month timeframes.
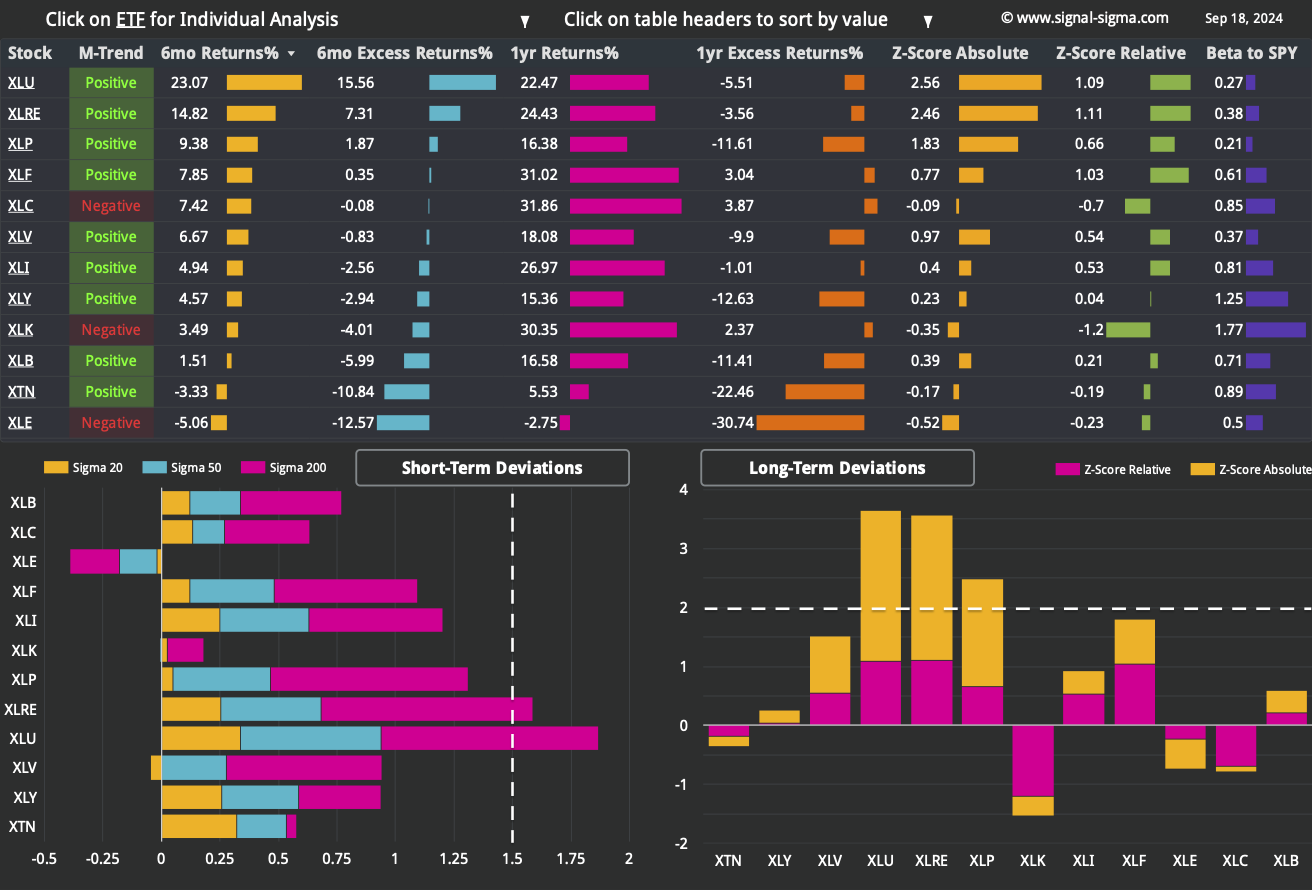
Here’s how we stand from a Sectors standpoint:


We have included 3 former tables from previous articles, for your convenience.
The Sectors dashboard paints the same broadly bullish picture as the Factors, with 2 glaring exceptions: Energy (XLE) and Tech (XLK).
Energy (XLE) stands out as the only sector trading below all key averages. In our view, Energy is approaching a good entry point, with most of the risk priced out at current levels. Energy should also act as a good hedge for other portfolio holdings, as it is relatively non-correlated to the broader market.
Tech (XLK) is an outlier because it is the sector with the highest downside relative-to-SPY Z-Score deviation. What that means in practice is that the sector (which is also the highest beta ETF) has provided almost no additional gains in relative performance since late May 2023. That’s an unusual amount of time for tech to provide the same returns as the broad market.
Technically speaking, the dip in Healthcare (XLV) also looks appealing, as both the R1 retracement level and the 50-DMA should provide good support.

Nostromo only holds 32% equity exposure via the Momentum Factor ETF (MTUM). On a sell signal, this position will be closed. It’s replacement is a plain SPY position, buyable whenever a signal occurs (unlikely at the moment).
For the bonds side of the portfolio, Nostromo is looking to buy TLT in size! The odds of a signal triggering there are much better, since TLT has already had a decent sell-off.
3. Individual Stock Selection

Millennium Alpha has just refreshed its portfolio composition. The following positions have been removed:
This month, 3 new positions have been added to the portfolio:
The portfolio is now mostly correlated to the Momentum Factor (MTUM) and Value Stocks (IVE). Industrials (XLI) and Tech (XLK) companies dominate on the sectors side. The strategy has also caught up to its benchmark (SPY) at the 3 month performance interval.
As we move closer to the elections and into the seasonally strong part of the investing cycle (November to April period), we’d like to emulate this portfolio more and more.
4. Market Environment
The next step in our process is to take into account the type of market environment that we are currently trading in. For these purposes we use the Market Internals and the Market Fundamentals Instruments. Comments on the overall state of the market can usually be found in our Weekly Preview Article.
Market breadth remains healthy this week. Levels are consistent with a positive trending market, without being exceptionally overbought. This is bullish.
Bullish Signal in Stocks trading above their 200-day Moving Averages
As a contrarian indicator, sentiment works best near extremes. The current reading (65/100) signals “Greed”, although not extreme just yet.
By necessity, a breakout to fresh record highs happens on optimism. At the moment, readings are not at levels where we’ve previously seen an immediate pullback. Sentiment is consistent with a steady up-trending market.
Neutral Signal in Sentiment
The comparison of Z-Scores reveals the disparity between large cap performance (SPY) and the top 1000 stocks by dollar volume (the broad market), equally weighted.
We have registered a continuous trend of improving relative performance of small caps. Think about this divergence as a pendulum which eventually swings in favor of either type of asset. If there is no recession in the U.S. in the next year, it’s reasonable to believe small caps will benefit and catch up in performance to their better capitalized peers, simply as a function of valuations and declining interest rates (small caps carry a valuation penalty, and debt at higher yields).
Bullish Signal in Market Internals Z-Score
In our analysis as of late, the Dollar Transaction Volume had been the sole bearish indicator. Both times (July and late August) that the market recently recorded relative highs, Dollar Volume was exceedingly low and did not confirm the price move.
However, during this last breakout attempt, Dollar Volume is confirming higher prices. There is interest in chasing the rally higher, and for the moment, this indicator turns bullish as well.
Bullish Signal in Dollar Transaction Volume

5. Trading in the Sigma Portfolio (Live)
After reviewing all of the above factors, it’s time to decide on the actual investing strategy for our real-life portfolio.
All of our analysis at the moment indicates that the market should be headed higher in the medium and long term. As such it makes sense to slightly increase our equity exposure, above the target weighting and essentially buying the breakout.
As far as the portfolio composition goes, adding Energy exposure opportunistically also makes sense. Tech also looks good. Gold has reached its technical limits for the moment and can be removed. And on the treasuries side, we can further extend our bond duration by swapping high yield bonds with TLT.
Automated Strategies and Market Outlooks

The Sigma Portfolio (Live)
We will execute the following trades at market close:
SELL 100% HYG (Close Position)
BUY 5% TLT (Add 5% to Position - now at 30%)
SELL 100% GLD (Close Position)
SELL 100% CTAS (Close Position)
SELL 100% CL (Close Position)
BUY 3% XOM (Initiate 3% Position)
BUY 3% APP (Initiate 3% Position)
BUY 3% ANET (Initiate 3% Position)
BUY 3% EME (Initiate 3% Position)
These adjustments will bring our equity exposure slightly up from 60% to 64% and better align our portfolio with the sectors and factors which are poised for outperformance in the year ahead.
Click here to access our own tracker for the Sigma Portfolio and understand how the positions contribute to the overall exposure profile.
In total, we stand to gain $18.986 by risking $9.417 if our targets are correct. The risk-reward equation is good, as for each $1 of potential risk, we stand to gain almost $2. At this stage, it makes sense to increase both our potential risk and the potential reward.