Major Markets Review April 20
Assessing the general trends in various asset classes periodically is an important part of portfolio construction and strategy implementation. In fact, a lot of decisions regarding asset class allocation are done at an algorithm level (see Enterprise Strategy), but it pays off to manually review trends one in a while.
In this article we shall explore the main asset classes taken into account in our investment system: equities (SPY), treasuries (TLT), commodities (DBC) and gold (GLD). You can find the dashboard for asset classes in the app right here.
We start off by looking at a 200 day performance chart comprising all ETFs, then check out the standard 2 year historical charts for each instrument.

What immediately stands out to me is not so much the blistering rally in commodities (DBC), but the abrupt downturn in long-term treasuries (TLT). Gold is turning up nicely, with an 8.15% appreciation, while equities slosh around in something of a consolidation pattern, with SPY up 2.8% since July 6 (when the analysis starts).
Clearly, the effects of inflation, the war in Ukraine and hawkish Fed rhetoric are playing an outsized role in the way the asset classes are performing. We'll now take a look at each ETF in particular.
SPY SPDR S&P 500 ETF

Caught between a rock and a hard place, SPY is treading water, compressed between support at the 50-day moving average (440.52) and the lower technical channel trendline (429.23). Resistance sits right above, clustered at the S1 retracement level (447.45) and the 200-day moving average (448.48). The Overbought / Oversold indicator is at 66, telling us exactly nothing. Overall, SPY is enjoying a positive Medium-Term trend and is trading at a -0.72 Z-Score deviation from the mean channel trend.
Takeaway: a break above 447.45 would be very bullish for SPY, and see a bevy of buyers step in. Conversely, a break below 429.23 would confirm a bear market is indeed developing.
TLT iShares 20+ Year Treasury Bond ETF

TLT has simply nosedived as of late, as heated inflation pushes the Fed toward more aggressive rate-hike policy. While initially reaction was muted, the velocity of the recent drop makes us think twice about owning long-term treasuries. From a contrarian perspective, this is an excelent time to buy. Our own Enterprise strategy does not yet recommend that. I will concede that TLT is up for at least a "dead cat bounce", sitting at extreme oversold levels (-1.33 Z Score and a full -3 Sigma Score), while below the lower trend channel level (123.00).
GLD SPDR Gold Shares ETF

Please excuse the busy chart. GLD is heavily deviated above it's 200-day moving average, which right now is acting like "gravity" on gold's furious ascent. Sitting right below the latest close is a cluster of support levels (circled in yellow). Essentially, without a significant change in macro conditions, it's unlikely GLD can breach these levels (around 178) convincingly. Time to get bullish on GLD here, and buy on weakness. At this point, it's also a better play than gold miners (GDX) which are heavily overbought when judged against the precious metal's base price (see relative chart).
DBC Invesco DB Commodity Index Tracking Fund ETF
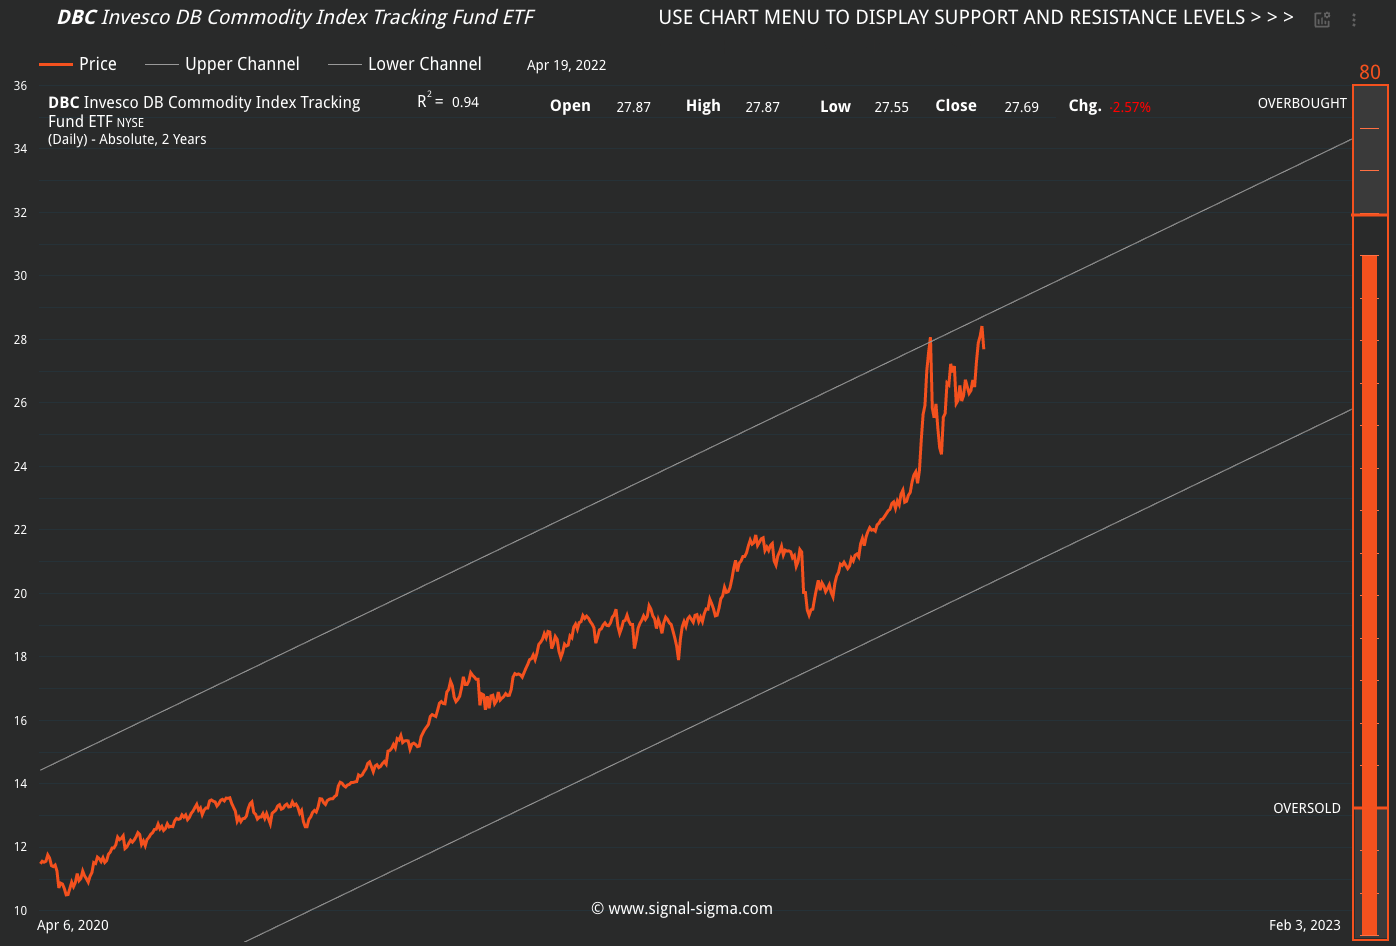
Overbought on almost any measure, the broad commodities tracker (DBC) is surging above its moving averages and hugging the upper part of the technical channel. While it's hard to make the case this is not the most crowded trade currently, it's also the asset class that performed best recently and momentum suggests it could remain the same in the near future. If you're a believer in trends, there is no stronger bandwagon to get onboard right now. It is our view that inflation is here to stay, as well, supporting ever higher commodity prices. Buyer beware though - at some point, the Fed will remove monetary policy that made all of this possible (at least according to their words). You don't want to be left holding the bag for this one.