S&P 500 Bottom - Up Valuation and Market Outlook
Summary
It’s not a Stock Market, but a Market of Stocks
Every quarter we like to assess the fundamental state of the market by closely analyzing the most important companies. To understand if the S&P 500 has more upside than downside, we need to define the recent rally leaders, create DCF models for each, and set price targets.
The distance from closing price to Price Target will tell us if there is indeed more upside, or if there is more risk than reward in the current setup. We shall rely on our Machine Learning models and company guidance to generate these models. The aim of this research piece is not necessarily to create accurate models individually, but as a group.
Defining Market Leadership
In order for us to focus on the correct companies, we need to find out what individual stocks are leading the market higher. Helping us achieve that goal is the concept of BETA, combined with Market-Cap. A stock’s beta is calculated using both correlation and covariance; the higher the number, the more that stock is moving with the market. Having a significant Market-Cap insures that the stock is also a driver for the market due to it’s size.

We set the screener to the top 300 companies by Market-Cap (X-Axis) and Beta to SPY to a minimum of 1 (Y-Axis) and make sure all companies are profitable by setting EBITDA higher than 0. Then, we’ll sort the screener to top 100 stocks by EBITDA. Unsurprisingly, the stocks that stand out by blending these 2 metrics include a lot of the usual suspects. We’ll note their weighting in the S&P 500 for reference:
Apple Inc. (AAPL) - 7.21%
Microsoft Corp. (MSFT) - 6.54%
Alphabet Inc. Class C & Class A (GOOG, GOOGL) - 3.94%
NVIDIA Corporation (NVDA) - 3.13%
Tesla, Inc. (TSLA) - 1.71%
Meta Platforms, Inc. Class A (META) - 1.75%
Broadcom Inc (AVGO) - 0.98%
Oracle Corporation (ORCL) - 0.48%
Adobe Systems Incorporated (ADBE) - 0.65%
There are also significant companies that we need to look at that are not necessarily “market moving” to the same extent:
Unitedhealth Group Inc (UNH) - 1.24%
Eli Lilly & Co (LLY) - 1.17%
Exxon Mobil Corp (XOM) - 1.17%
Johnson & Johnson (JNJ) - 1.07%
Procter & Gamble Co (PG) - 0.98%
Combined weight in the S&P500: 31.58% - it’s safe to say that price movements for this small subset of companies will have the most significant impact on market performance going forward.
Analyst Price Targets and Statistics
We’ll input these stocks into our Risk Explorer Screener in order to quickly assess both their fundamental and statistical risk-reward set-up.
This screener type shows us the average combined expected move to different key levels (assuming equal weight positions). We are more interested in their fundamental distance to Price-Target in this article (currently at 9.94%), so let’s adjust that for index-weighting.
That comes down to an expected 9.68% combined price appreciation, if all of these companies would reach their analyst Price Targets in the next year. However, are those Price Targets realistic? What are the underlying assumptions?
We need to investigate further and create our own models in order to validate these assumptions. We will employ the help of our ML models for this task, and set projections to Neutral. As an extra step before assigning a Price Target, we will check with individual sell-side analysts and see if they agree.
Models & Price Targets

Apple Inc. (AAPL)
Signal Sigma PT: $190 (Raise from $170)
Analyst PT: $200.68
Upside: 7.72%
Rating: BUY
Assumptions:
7% Revenue Growth
44% Gross Margins
12.5% OpEx pct Sales
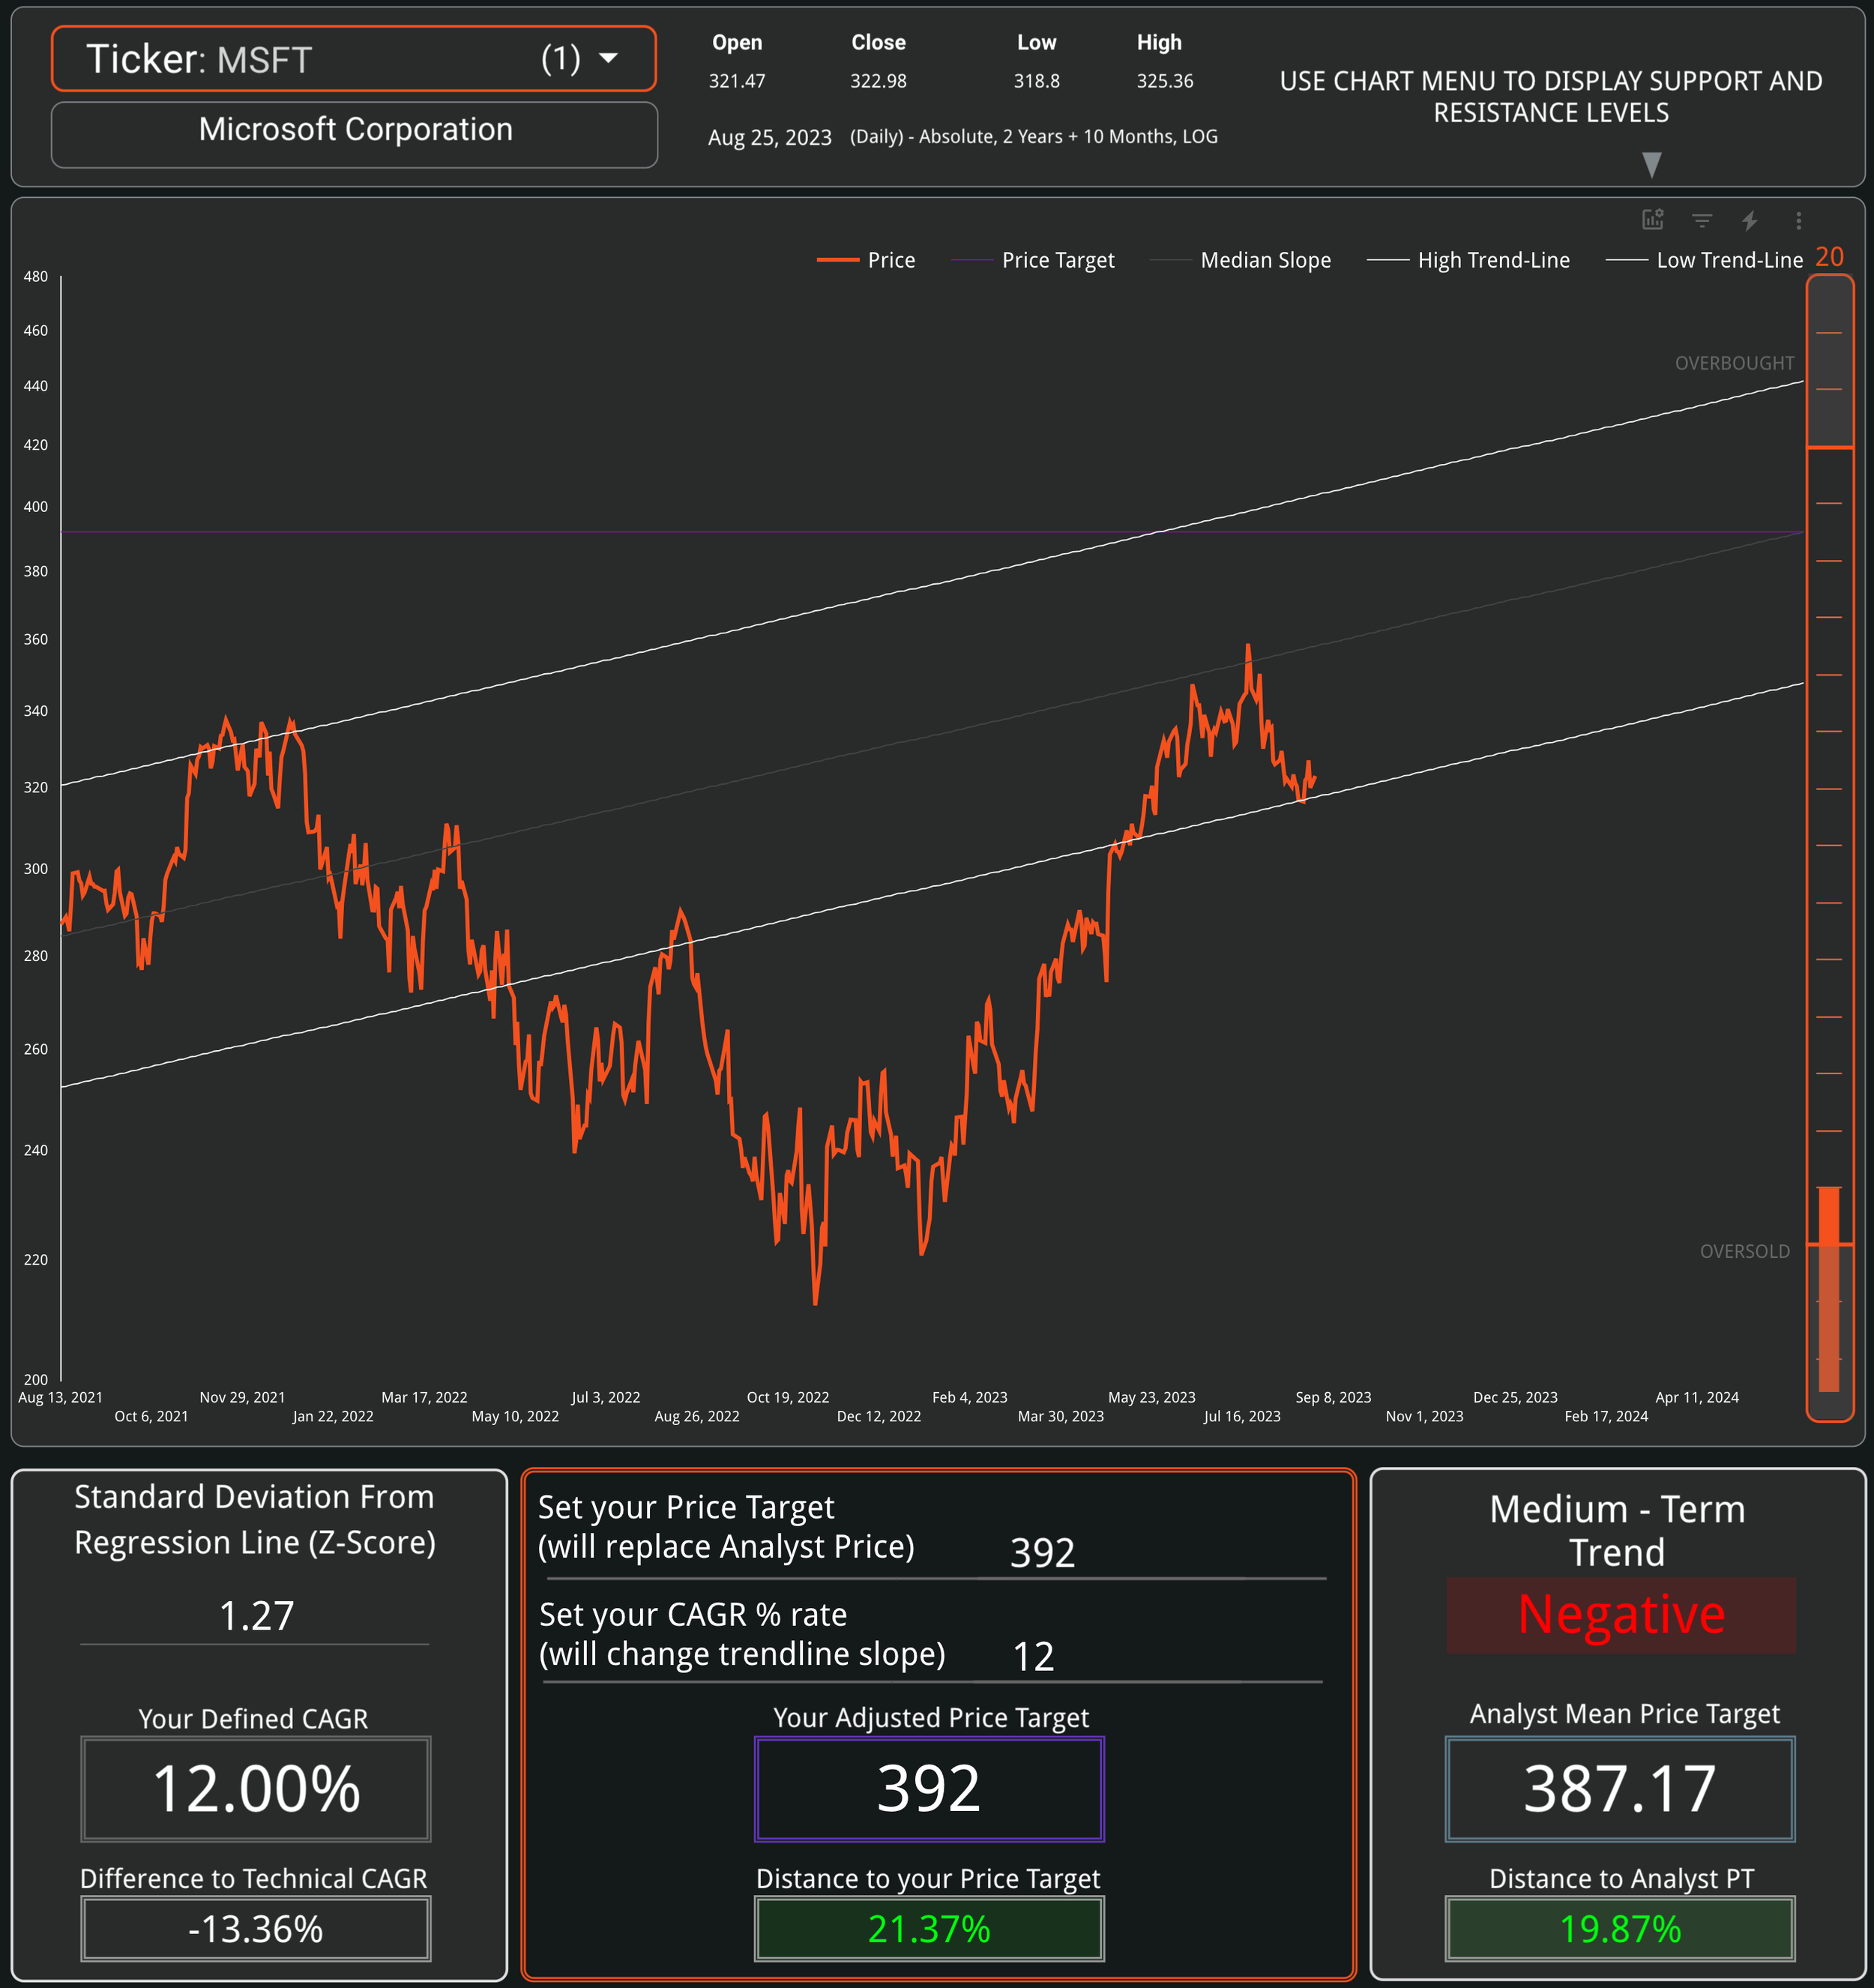
Microsoft Corp. (MSFT)
Signal Sigma PT: $392 (Raise from $350)
Analyst PT: $355
Upside: 22.51%
Rating: BUY
Assumptions:
12% Revenue Growth
68% Gross Margins
27% OpEx pct Sales
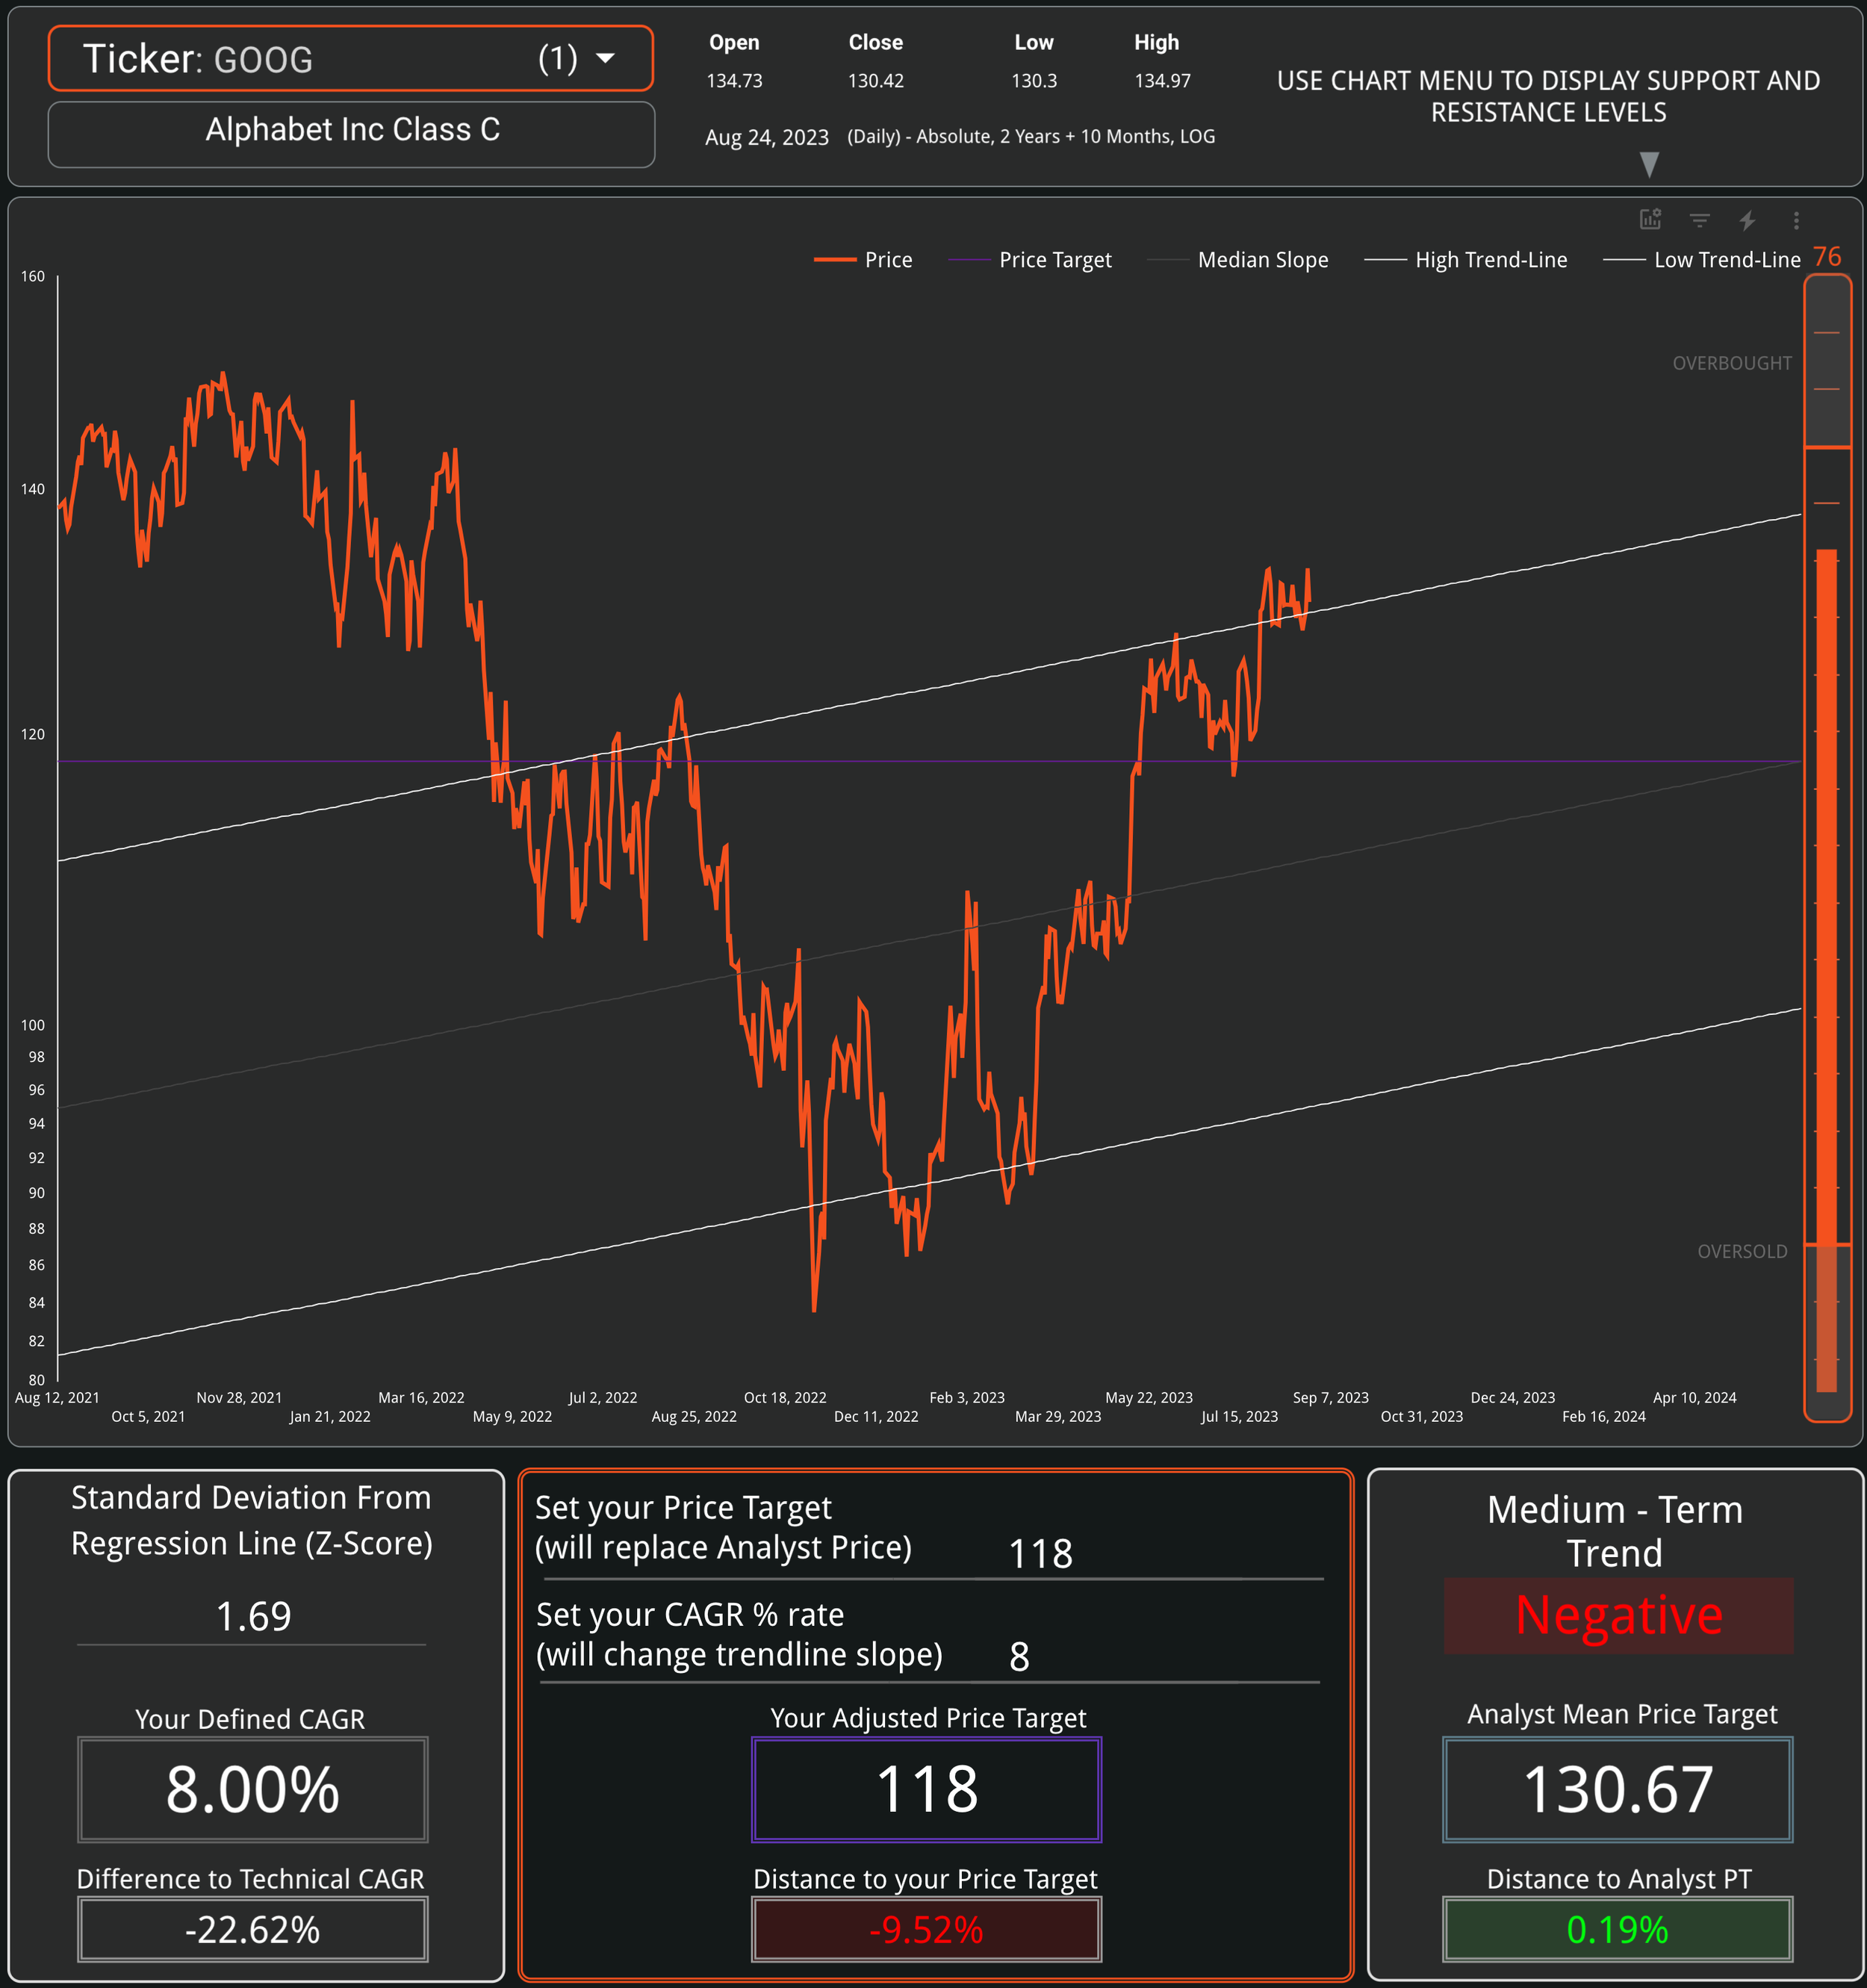
Alphabet Inc. Class C (GOOG)
Signal Sigma PT: $118 (Raise from $117)
Analyst PT: $130
Downside: 9.52%
Rating: HOLD
Assumptions:
9% Revenue Growth
53.5% Gross Margins
30% OpEx pct Sales

NVIDIA Corporation (NVDA)
Signal Sigma PT: $570 (Raise from $476)
Analyst PT: $524
Upside: 20.65%
Rating: HOLD
Assumptions:
34% Revenue Growth
60% Gross Margins
30% OpEx pct Sales

Tesla, Inc. (TSLA)
Signal Sigma PT: $236
Analyst PT: $239
Upside: 2.59%
Rating: BUY
Assumptions:
24% Revenue Growth
20% Gross Margins
7% OpEx pct Sales

Meta Platforms, Inc. Class A (META)
Signal Sigma PT: $242
Analyst PT: $363
Downside: -5.14%
Rating: BUY
Assumptions:
11% Revenue Growth
78% Gross Margins
50% OpEx pct Sales

Broadcom Inc(AVGO)
Signal Sigma PT: $785
Analyst PT: $883
Downside: -7.84%
Rating: BUY
Assumptions:
7% Revenue Growth
73% Gross Margins
18% OpEx pct Sales

Oracle Corporation (ORCL)
Signal Sigma PT: $110
Analyst PT: $124
Downside: -5.22%
Rating: SELL
Assumptions:
14% Revenue Growth
74% Gross Margins
43% OpEx pct Sales

Adobe Systems Incorporated (ADBE)
Signal Sigma PT: $495
Analyst PT: $555
Downside: -5.73%
Rating: BUY
Assumptions:
12% Revenue Growth
88% Gross Margins
52% OpEx pct Sales
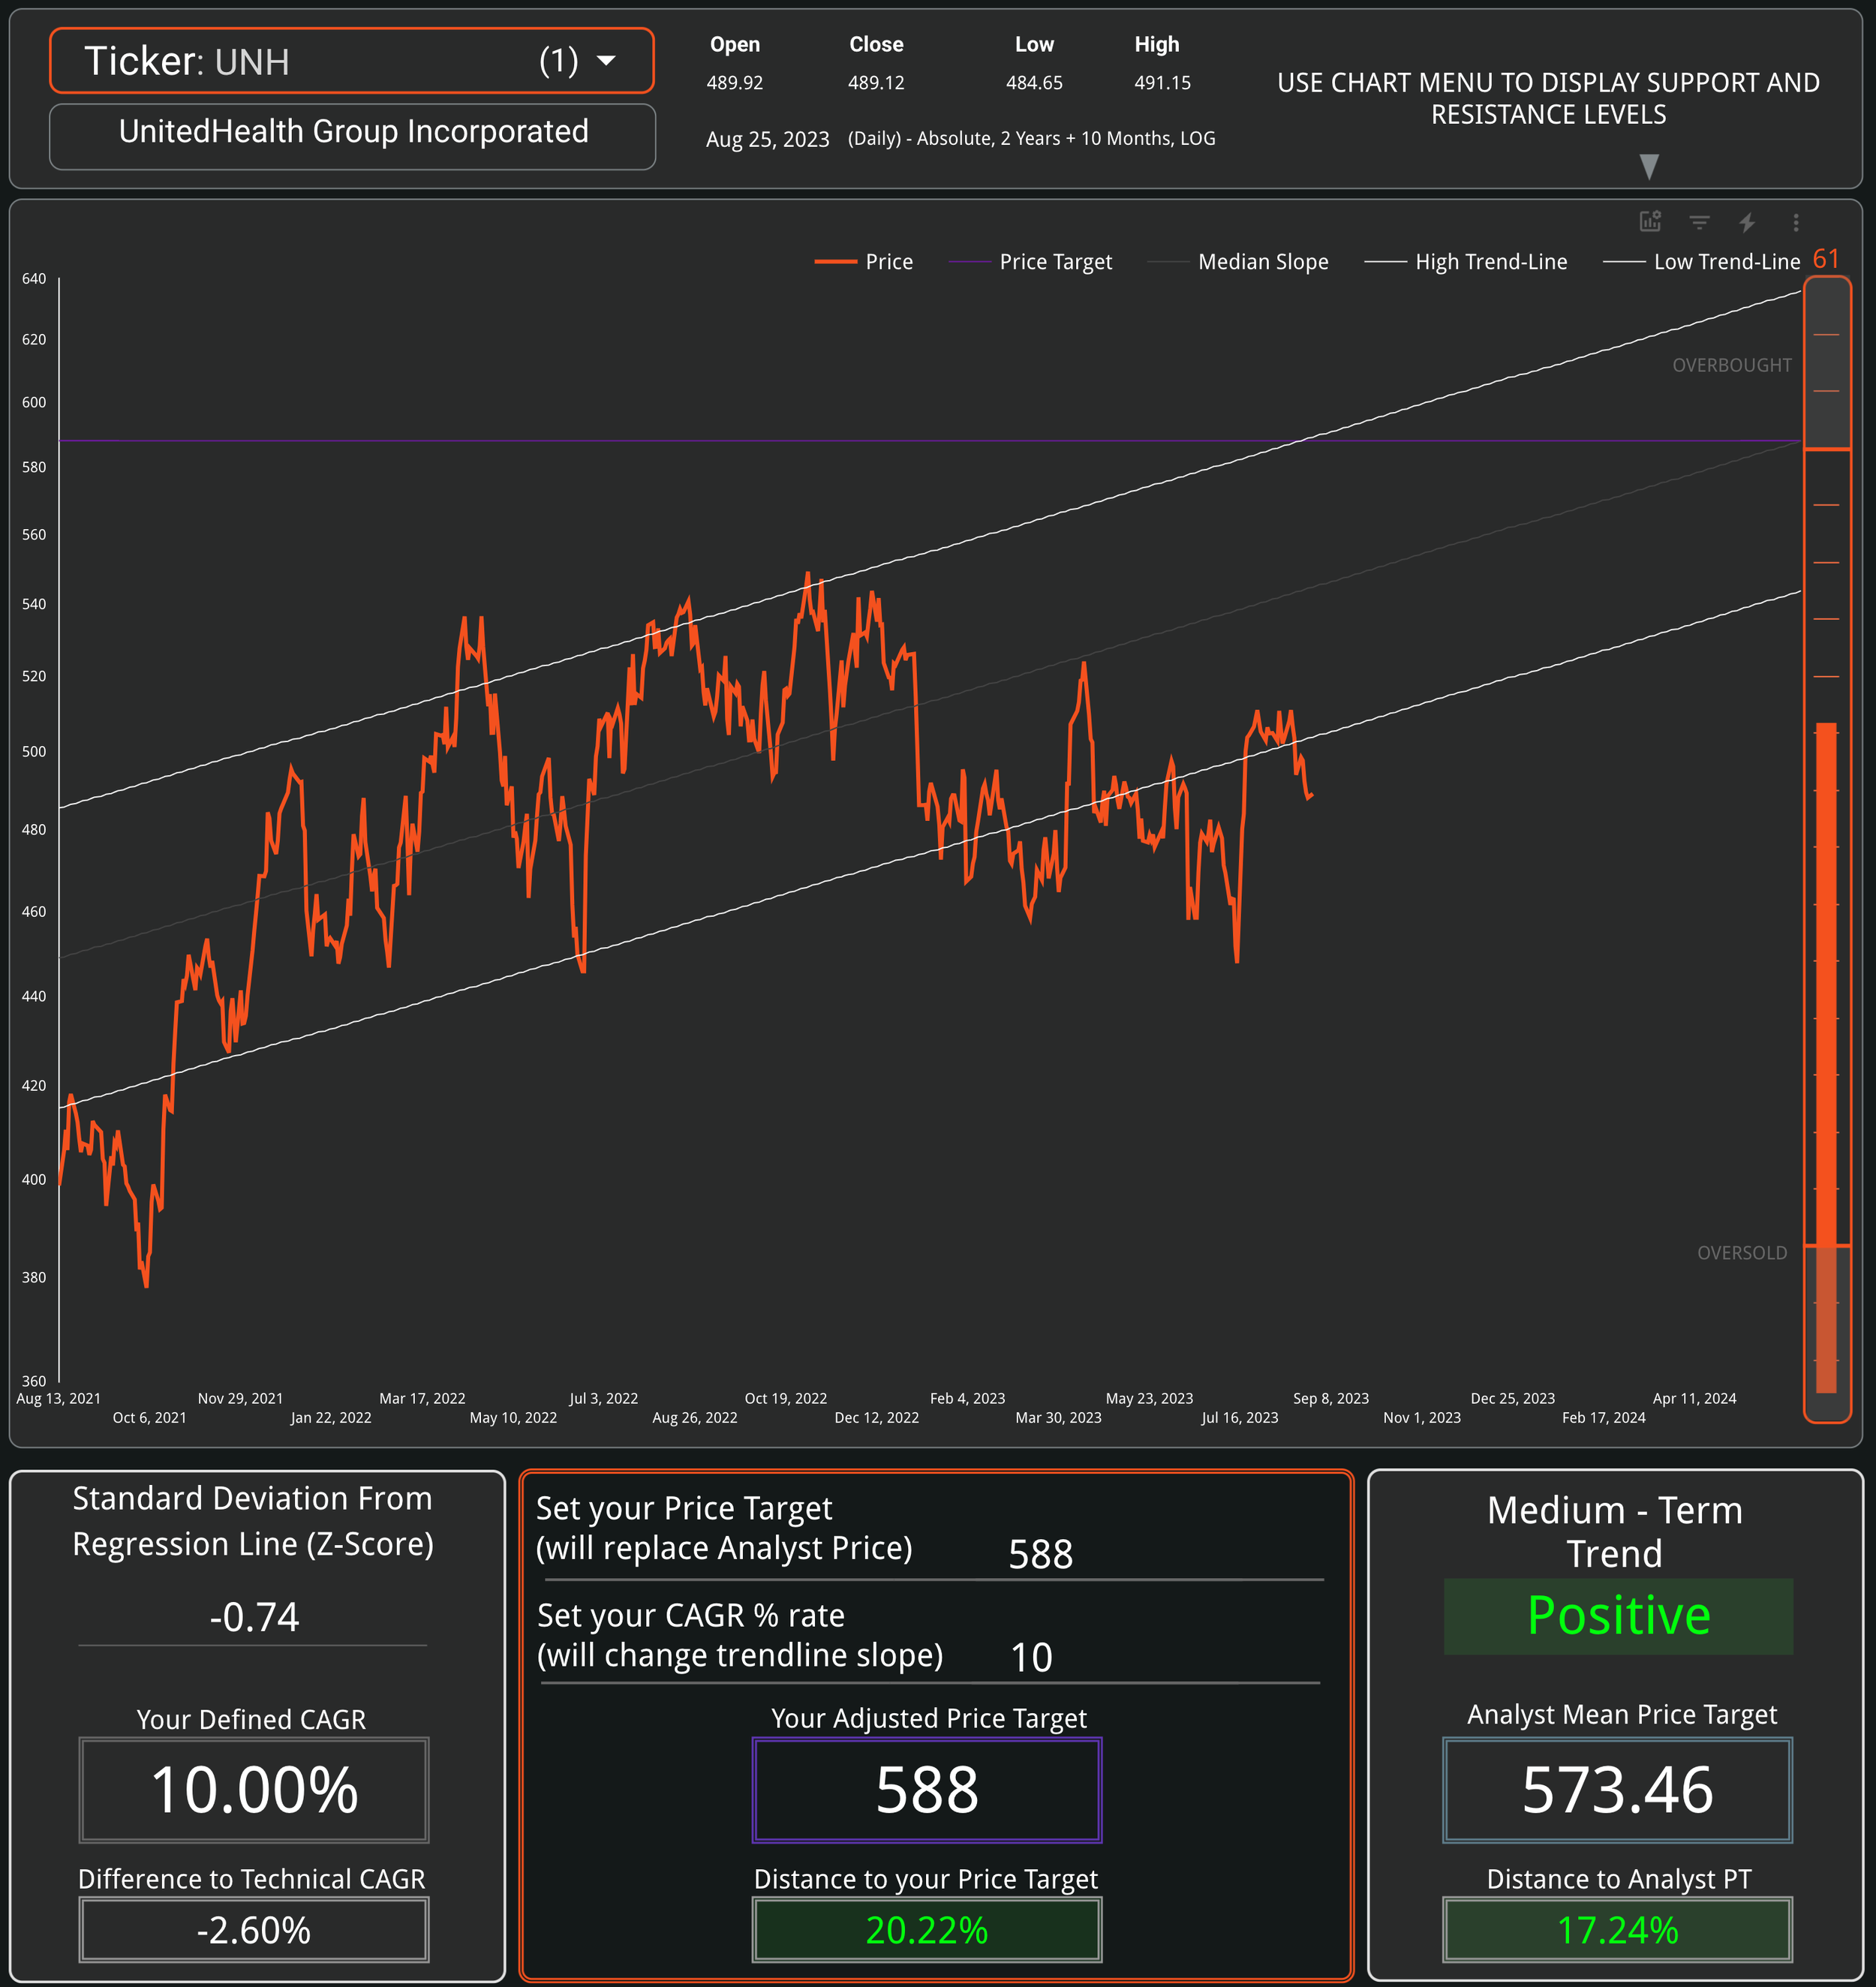
Unitedhealth Group Inc (UNH)
Signal Sigma PT: $588
Analyst PT: $573
Upside: 20.22%
Rating: BUY
Assumptions:
8.6% Revenue Growth
24.3% Gross Margins
16.2% OpEx pct Sales
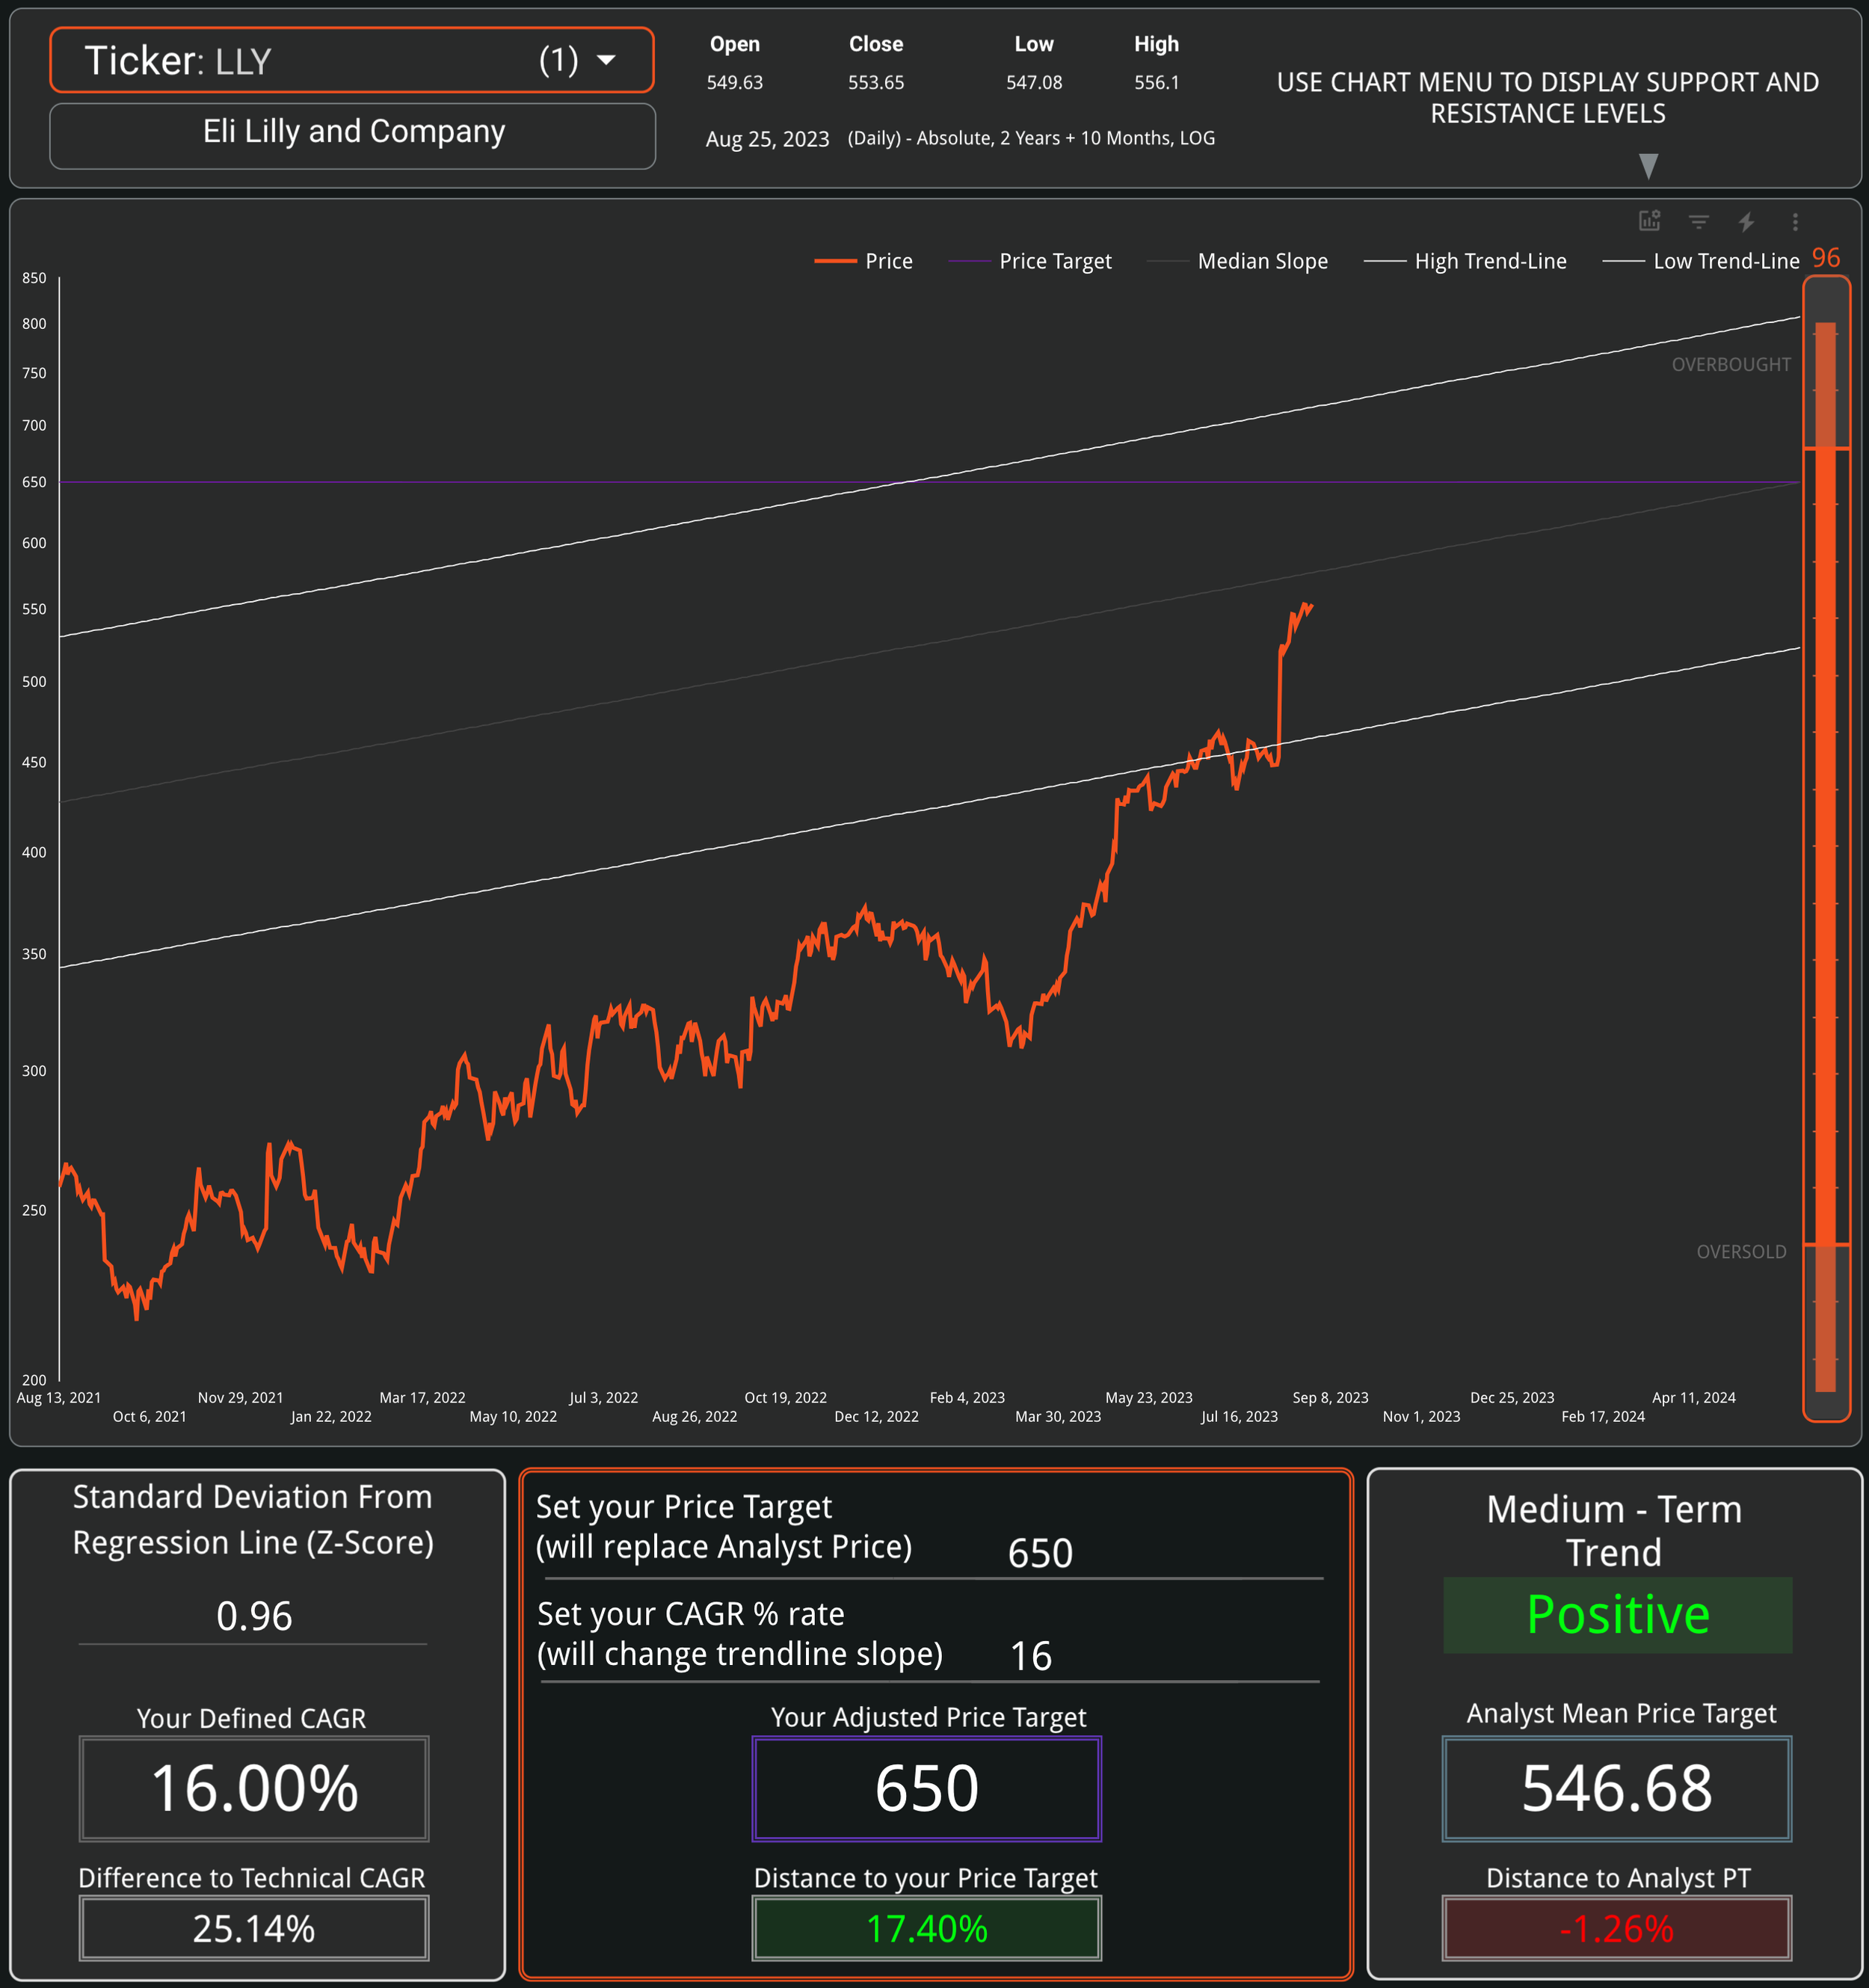
Eli Lilly & Co (LLY)
Signal Sigma PT: $650
Analyst PT: $546
Upside: 17.40%
Rating: BUY
Assumptions:
13% Revenue Growth
80% Gross Margins
47% OpEx pct Sales

Exxon Mobil Corp (XOM)
Signal Sigma PT: $124
Analyst PT: $122
Upside: 14.55%
Rating: HOLD
Assumptions:
3% Revenue Growth
63% Gross Margins
12% OpEx pct Sales

Johnson & Johnson (JNJ)
Signal Sigma PT: $163
Analyst PT: $184
Downside: -1.95%
Rating: HOLD
Assumptions:
2.8% Revenue Growth
65% Gross Margins
41.7% OpEx pct Sales

Procter & Gamble Co (PG)
Signal Sigma PT: $178
Analyst PT: $166
Upside: 15.93%
Rating: BUY
Assumptions:
3.6% Revenue Growth
49% Gross Margins
24.3% OpEx pct Sales
S&P 500 Valuation and Summary of Models
Now that we have compiled models and Price Targets for the top market moving stocks, representing over 30% of the S&P 500’s weighting, it’s time to combine their risk-reward into a single number that we can use as a proxy for the whole market. This will serve as the basis of our analysis going forward.
Combined Upside (Equal Weight): 6.19%
Combined Upside (Market-Cap Index Weight): 2.39%
SPY Price Target: $450 (assuming Market-Cap Index Weight upside)
General Observations
Before we create the 3 fundamental scenarios for the market (optimistic, neutral and pessimistic), we’d like to cover some observations drawn from working on the models. There are a couple of market dichotomies:
Mega Caps vs Mid and Small Caps
As an exercise in curiosity, we used the Risk Explorer to rank the bottom 15 companies that make up the S&P 500 and get an average of their distance to thier respective Analyst Price Targets. Here are the results:

These bottom 15 stocks are not exactly small caps, with the last entrant (NWL - Newell Brands Inc) sporting a market cap of 4.25 B. Their combined index weight is just 3.1% in the S&P 500, but their combined upside is 28.95% if equally weighted in a portfolio. Compared to the meager 9.94% upside of the top 14 stocks, this figure puts large caps to shame. It also speaks of the risks investors see in the outlook if an economic downturn approaches. Our Z-Score Divergence chart also tells the story of different fortunes when it comes to mega caps and every other stock. Investors betting on small and mid caps are also betting on this divergence resolving itself.

Tech vs Non-Tech
Out of the companies we just analyzed, we couldn’t help but notice that most “market drivers” are tech related. These tend to be fully valued at the moment and present very little upside potential, barring exceptional results: GOOG, ADBE, AVGO, ORCL. There are exceptions when it comes to tech, especially when companies are involved in A.I. : MSFT, NVDA, AMD. At least this is our opinion.
The reality is that tech has indiscriminately been the winner of 2023, with a lot of companies along for the ride just as a function of their market cap and passive investing flows (QQQ, XLK ETFs). This will most likely not be the case going forward, with a couple of notable exceptions.
However, when looking at non-tech companies (XOM, PG, UNH, LLY), we see much better upside - in the double digits, for each! Here is a chart of QQQ (white) plotted against general market factors IWM, MDY, RSP (orange). After a much bigger bear market, large cap tech has fully caught up and surpassed the performance of the broad market.

Market Scenarios
SPY Optimistic Scenario (A)
Our optimistic scenario for the market assumes no recession on the horizon in the next year, plenty of liquidity and subdued inflation (no more rate increases). In this case, many upwardly revised Price Targets can be reached for individual stocks, and thus for the market. The Price Target for SPY is what sell-side analysts suggest: $482, representing a 9.5% upside to the last close price.
Small and Mid-Caps will rally disproportionately, as the economy chugs along.
We will assign this scenario a decent probability of 50%.

SPY Neutral Scenario (B)
In a neutral scenario, economic conditions get tougher and tighter. The lags from monetary policy are finally catching up with us. Volatility hits the market again, as dollar liquidity disappears (presumably through QT). Swings in prices become more frequent and wide. This is a scenario where only quality and large cap companies flourish, as they are less economically sensitive. Mid and Small caps continue to underperform. However, a sector rotation can help non-tech companies keep the index afloat and find their upside. The Price Target for SPY is $450, representing a 2.4% upside, but the Equally Weighted S&P500 (RSP) might benefit with a 6 - 9 % upside in the event of a sector / factor rotation.
We will assign this scenario a decent probability of 40%.

SPY Pessimistic Scenario (C)
In a pessimistic scenario, growth slows and inflation re-accelerates, forcing the Fed to hike more than once. Yields shoot higher and valuations become harder and harder to justify. Stocks experience another bout of significant price volatility and in the absence of tech leadership they essentially go nowhere. As a consequence, impatient investors start pulling capital from equity funds and liquidity is further drained. Companies that outperform are outliers in their field and create undisputable value for their shareholders. Everyone else under-performs. The Price Target for SPY is $420, with a -4.5% downside.
We will assign this scenario a decent probability of 10% as technicals suggest a more bullish outcome is probable.

Takeaway
So which one is it going to be? Scenario A, B, or C presented above? As I’ve repeated many times, our job is not to attempt to make predictions, but to manage risk. In our opinion, the odds are split between scenarios A and B with a combined 90% probability.
In terms of positioning, going forward, we’ll be prudent and selective with our large cap tech names. We’ll only aim to get exposure to the best of the best and avoid broad ETFs (like QQQ or XLK).
Small and Mid Caps + non tech large caps are also high on our watchlist. The name of the game here is quality. As long as companies deliver a solid operating model with sustained revenue growth and margin expansion, they should be rewarded by the market sooner or later, no matter their specific sector. We are basically looking for a portfolio mix that can appreciate in any of the upside scenarios.
As can be seen in the charts, SPY can “crash” to $400 - $410 and still be well within the bounds of all of the scenarios above. In this regard, we’ll employ careful risk controls for each of our positions (STOP-LOSS points). If the market violates the $400 level, we’re probably in a different ballpark and need to reassess the outlook.
For now, however, we’ll be looking for opportunistic entry points to increase risk exposure into year end.
Good luck out there! Chime in if you need any help with your strategy!
Andrei Sota
Enjoyed this Article ?
Vote for the next Sector or Factor to be covered in a similar way below: