Portfolio Rebalance / April 19
Following the Signal Sigma Process
Tuesday is the day when all of our strategies rebalance their asset class holding weights. The approach to this article follows the step by step process described here.
This week features a reduction in targeted treasuries exposure as well as a slightly increased equity exposure; Horizon’s portfolio has been rebalanced with new positions, while Enterprise and Nostromo are hunting for the right signals to complete their trades.
Asset Class Allocation
The first step in determining optimal portfolio positioning is taking a look at the performance of the main asset classes, and determining which are suitable for investment. The Asset Class Overview Instrument gives us a clear macro picture.

There are no notable changes from last week; the whole market seems frozen in a holding pattern, waiting for the next important catalyst;
The US Dollar is languishing near the lower trend-line. It has been able to hold the technical support level despite the selling pressure. We believe that given the current correlation regime (studied below), the S&P500 and the dollar are fundamentally mirror images of the same trade. Both are near their technical limits.

We are constantly checking for a break in the current negative correlation regime between the US Dollar (white) and every other asset class, combined (orange).
There is no change in the overall environment yet, but emerging signs that this correlation could break are there. Overall, the asset groups are inversely correlated but we would have expected to see the dollar trade lower, given the rise in multiple asset classes. We have drawn out a short term technical channel (grey dotted lines), with an identical slope. If this trend is set to continue, it would finally break the inverse correlation regime.

Enterprise has reduced target exposure to long-term treasuries, and kept equities at the same level. No signals have triggered the past week.
The Enterprise Strategy

Enterprise, our most conservative model, is entering the week 15% long Treasuries, and 85% in CASH.
Since this model only trades 4 asset class ETFs, we use it to judge overall portfolio positioning.
Equities are targeted for exposure at 54% of portfolio value (similar to last week), via SPY ETF. The position will be filled when SPY triggers a BUY signal without violating M-Trend support (now at $389).
The model’s treasury allocation is underweight for the time being, and is meant to be increased on the next available BUY signal (from 15% currently to 20%).
At 85% Cash is still the dominant position for this model by far.
2. Sector / Industry Selection
The next step in creating our portfolio positioning is to break down each broad asset class into more granular groups of assets. This will help us understand which pocket of the market is outperforming or underperforming and make our selection accordingly.
Since Equities are an investible asset class, we’ll take a look at how different Factors are performing and check for any notable opportunities.


We have included tables for this week and the prior 3 weeks in order to help you compare developments (click on the arrows or thumbnails to cycle through the tables).
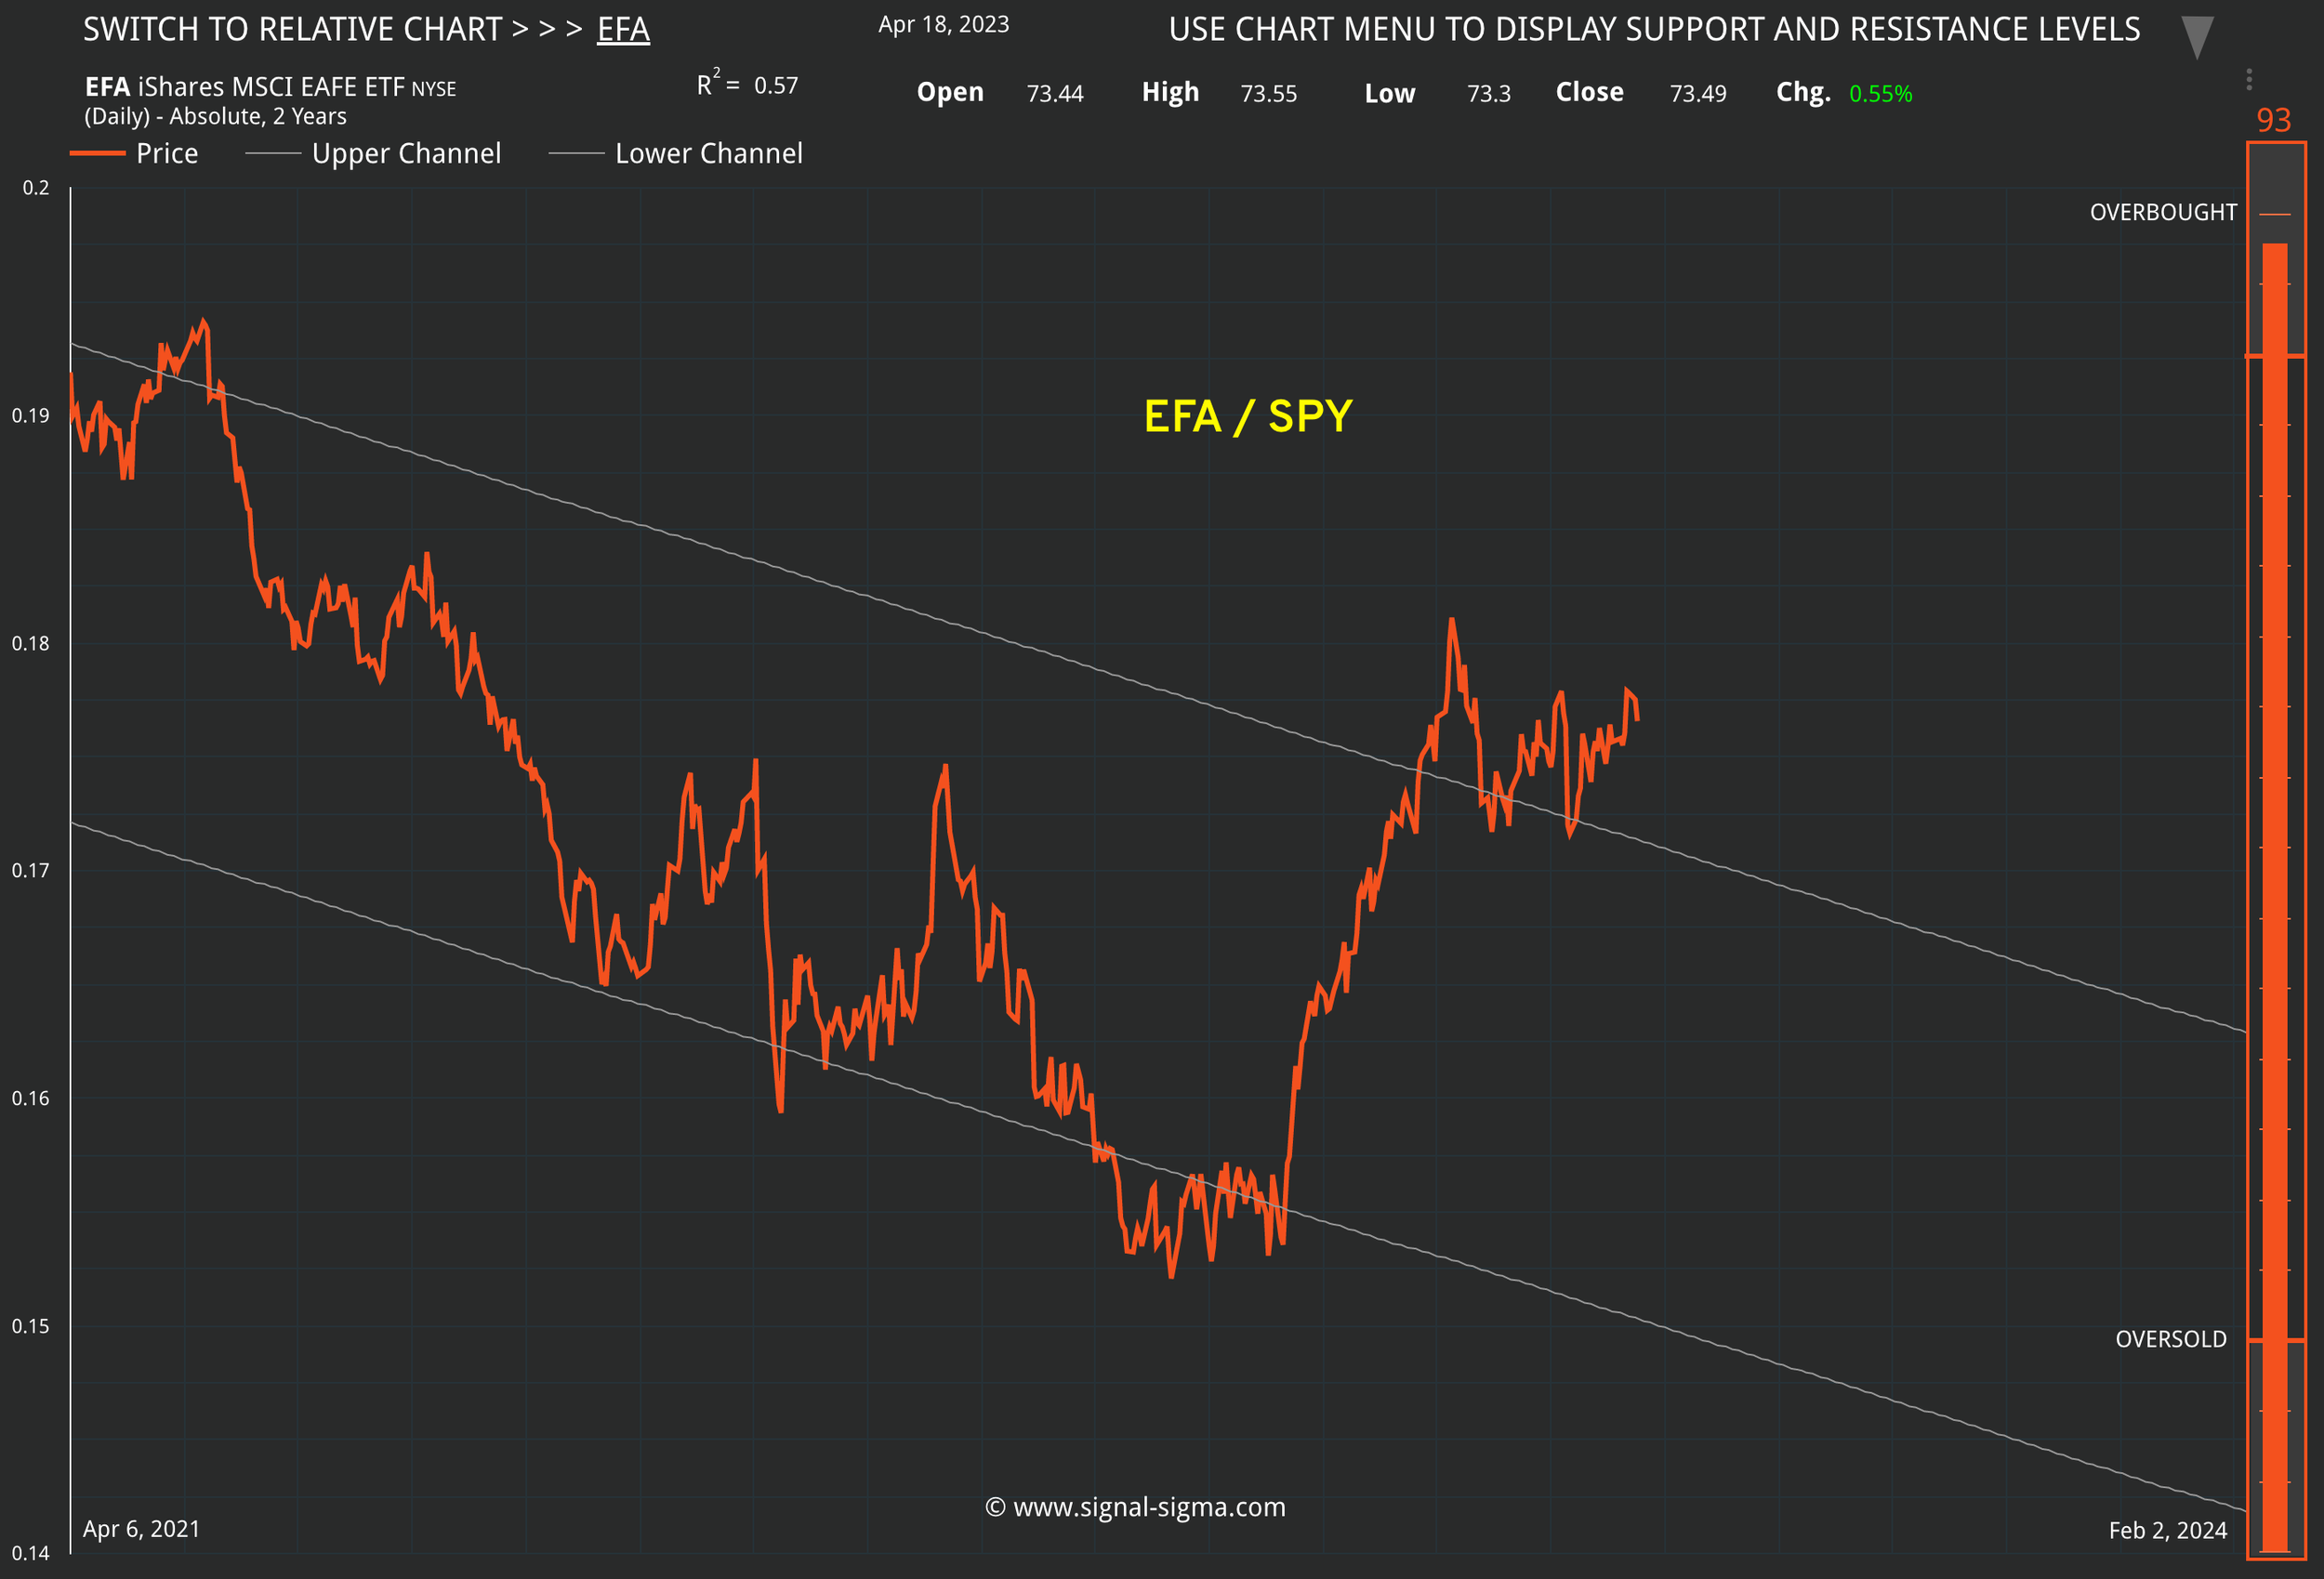
This week, the recovery in factors has continued, albeit with less of change than in previous weeks. Foreign Developed Markets (EFA) are extremely deviated to the upside at this point and look like breaking out in absolute terms (see chart below). In relative to SPY terms, performance has been struggling, as SPY has kept up. The Nasdaq (QQQ) is similarly at the limit of its technical channel, and losing ground to SPY in relative terms. Both of these ETFs are prone to profit-taking, as we suspect money would rotate to mid-market ETFs (MTUM, MDY, SLY).
SLY (Small Caps) and MDY (Mid Caps) are the only factors still trading below their 50-Day Moving Averages, due to their exposure to bank stocks.
By using our proven selection criteria (Z-Relative > 0, while Sigma 50 < 0), no factors are set up for a technical trade.
Charts Emphasis:
Foreign Developed Markets (EFA) in absolute and relative to SPY terms, Nasdaq (QQQ) relative to SPY.


Here’s how we stand on the Sectors front:


We have included the last 3 weeks of tables as well, for your convenience.
Sectors are showing a healthy disposition, with all ETFs trading above their 20-Daily Moving Averages. Tech (XLK) is looking extended longer term, with both long and short term deviations pushing extremes. Communications (XLC) are similarly extended and testing the limits of technical extremes.
Defensive sectors that are also rate-sensitive Utilities (XLU), and Real Estate (XLRE) are under-performing, and unable to clear their 50-Day Moving Averages, despite the broader rally in the market. Healthcare (XLV) is consolidating after a monster rally, with Industrials (XLI) and Basic Materials (XLB) also taking a breather. Financials (XLF) have finally bounced convincingly after JP Morgan reported a blowout quarter.
There are no sectors that fit our selection criteria for a technical play at this point.
Charts Emphasis:
Financials bouncing, Healthcare consolidating, and Tech pushing the limits.


Nostromo will revert to targeting a standard stocks / bonds portfolio comprised of SPY and TLT ETFs. It has sold the position in Mortgage Backed Securities (MBB) last week.
The Nostromo Strategy

Nostromo, our tactical allocation model, is holding equity risk exposure via 2 Foreign Market ETFs.
The strategy would rather swap these ETFs for a single SPY position (if the relevant signals trigger).
EFA and EEM positions are slated to be closed on their respective SELL signals. SPY will be bought on a BUY signal, even if the EEM and EFA positions will not close.
On the treasuries side, Nostromo plans to allocate towards TLT (Long-Term Treasuries) on the next BUY signal.
For more info about how Nostromo targets sectors or factors within a broader asset class, read this article. The first part sheds some light on the selection process going on in the background.
3. Individual Stock Selection
This week, we would like to screen for the “usual suspects” - quality stocks that are leading the market higher. This screener is called Momentum + Quality and closely resembles the logic found in the Horizon strategy.
The screener rules are:
Piotroski F Score => 6; this ensures Quality
6 month & 1 Year Absolute Returns > 0; a basic momentum requirement
Sharpe Ratio > 1; very favorable risk-reward
Z-Relative > 0; stock outperforms its benchmark ETF
MACD Trend is Positive; medium term momentum is trending up

With an output of 19 positions, those at the right of the lower graph (TGLS, SMCI, IPAR, etc) are stocks that have seen exceptional returns over the last 6 months. Those would be Momentum pure plays. A more opportunistic approach would be to focus the research on the stocks that have seen less of an appreciation: MRK, MSI, PWR.
We can use the Fundamental Explorer instrument to take a deep dive into their financials. Then, use the Valuation Wizard to generate a Price Target, and see the target on a chart using Technical Analysis. We might uncover some potential candidates for our portfolio!
The Horizon Strategy

Horizon has rebalanced the equity portfolio this week (a once every 4 weeks occurrence). Treasuries have been reduced from 41% previously to just 20% now.
New Positions (Initiated):
CIVI
WFRD
HES
RRC
CHK
TGLS
LSI
Reduced Positions:
IPAR
TLT
TDW
Closed Positions:
ACLS
MPC
INSW
RS
LSCC
JBL
OI
This model has performed poorly as of late. It’s equity curve is more related to the Momentum Factor ETF than SPY. Momentum has lagged the broader market, and has touched previous-low levels.
As an aggressive equity exposure model, Horizon has got trapped in repeated “bear-market rallies”. Eventually, those will end sooner or later and this model will start performing closer to its historical metrics.
4. Market Environment
The next step in our process is to take into account the type of market environment that we are currently trading in. For these purposes we use the Market Internals and the Market Fundamentals Instruments. Comments on the overall state of the market can usually be found in our Weekly Preview Article.
This week, we are noting the same divergence between SPY’s Sigma Score (1.58 this week vs 1.33 last) and the Broad Market’s (0.28 this week vs 0.27 last). Judging by the Sigma Score evolution, we can surmise that SPY has surged higher, while the average stock has not. The narrow market is problematic for a further advance.
There is also a bearish “head-and-shoulders” technical formation taking shape in the number of stocks trading above their 200-DMAs. While the market is pushing higher, and nearing its most recent peak, it is not supported by underlying technicals. Most stocks are still not following SPY’s performance, and a narrowing market is not good news for the bulls. There are more stocks trading above their 200-DMAs this week than the last, but barely so (585 vs 581).
Bearish Signal in Stocks trading above their 200-day Moving Averages

The market is no longer oversold. It is not yet overbought either, like in previous topping processes. This is an indicator that works best at market extremes, and we are not in either situation right now. However, the push higher from this indicator is mildly bullish for now.
Neutral Signal in Stocks Overbought / Oversold

In terms of Z-Score divergence, the bearish difference noted in the first panel persists, at levels higher than last week. At 0.87 now vs 0.69 last week, SPY is well ahead of the average stock (0.24 this week vs 0.2 last). This is representative of a narrow market, reliant on the performance of a couple of stocks. The widening divergence does not make for a healthy bull market.
The same “head and shoulders” formation can be witnessed in the lower panel, for the average stock’s Z-Score.
Bearish Signal in Market Internals Z-Score

Dollar Transaction Volume has declined to below average and has stayed there for a couple of weeks. Realized Volatility has also taken a dive, to the peaceful levels recorded in late-stage bull markets. For the moment, we’ll interpret this data as neutral. We’d like to see higher transaction volume to support a further equity market rally (low volume in a rally is bearish).
Neutral signal in Average Dollar Transaction Volume and Volatility

5. Trading in the Sigma Portfolio
After reviewing all of the above factors, it’s time to decide on the actual investing strategy for our real-life portfolio.
Nostromo and Horizon agree on overall equities exposure. Enterprise and Horizon are in alignment on the treasuries side, while Nostromo holds no exposure to fixed income.
To start, we will take an average of CASH position sizing from all of our models. This will come down to 52%, with a wide 85% - 20% allowed. Equity exposure stands at 36% on average, while on the treasury side models average 17.5%.
Automated Strategies


The Sigma Portfolio (Live)
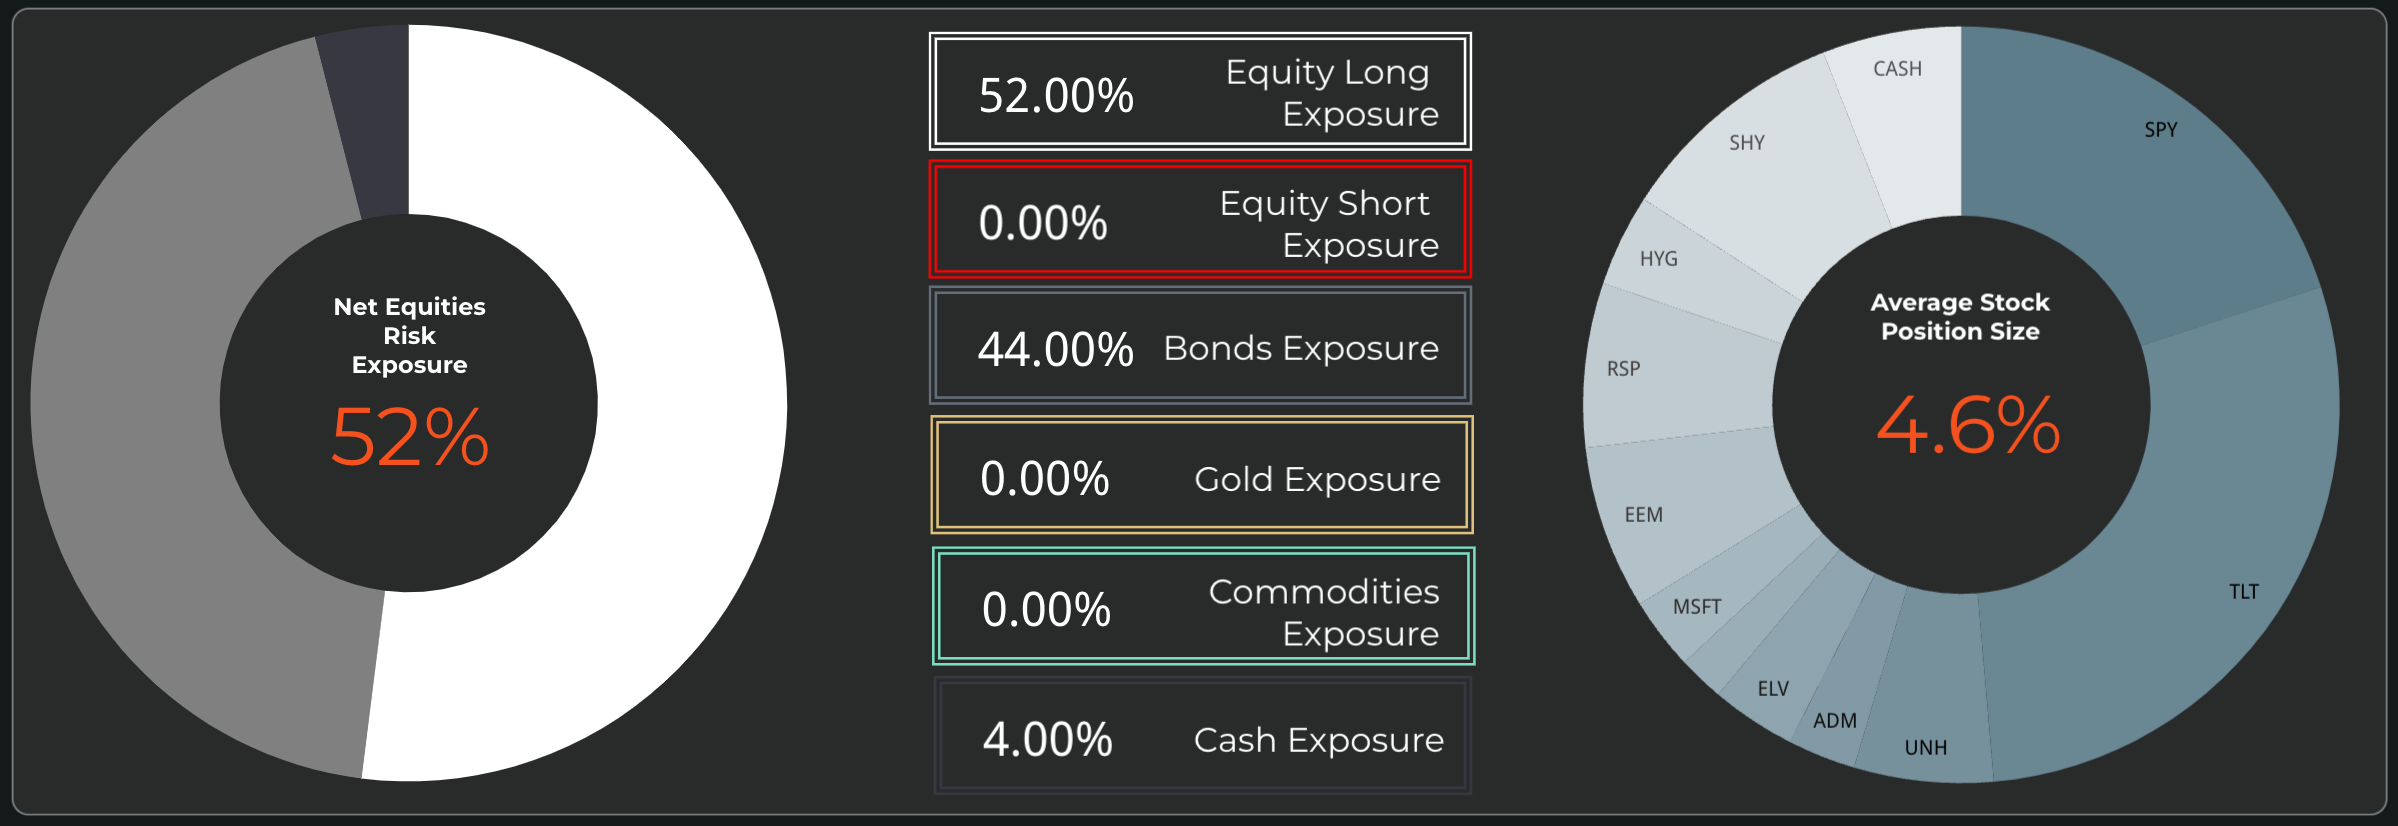
The Sigma Portfolio has a single glaring divergence to all of the other models, namely the treasury exposure. While 10% is dedicated to short term treasuries (SHY) and 4% is held in Corporate Bonds (HYG), the remaining 29% consists of long term treasuries (TLT). This position needs to be brought more in line with our models, by shifting exposure from TLT to SHY and shortening bond duration. We are also keeping an eye on healthcare companies ELV and UNH, which have pulled back in a bout of profit taking despite beating estimates and raising guidance.
Executing the following orders at the close:
SELL 50% TLT (Reduce Position by 50% - to 15% weight)
BUY 15% of portfolio in SHY (add 15% to Position - to 25% weight)