Portfolio Rebalance / February 7
Following the Signal Sigma Process
Tuesday is the day when all of our strategies rebalance their asset class holding weights. The approach to this article follows the step by step process described here.
This week we are preparing research on individual names in case we get the “all clear” to allocate to equities in the following couple of weeks. The Stock Report section of the platform has seen a lot of activity, and will continue to do so, as we uncover investment opportunities. We suggest you check it out! In the meantime, we are patiently waiting for the market’s consolidation process, before proceeding with any kind of aggressive move. There are a couple of positions that we will initiate at the close today, simply because their particular risk-reward levels are looking good right now.
Asset Class Allocation
The first step in determining optimal portfolio positioning is taking a look at the performance of the main asset classes, and determining which are suitable for investment. The Asset Class Overview Instrument gives us a clear macro picture.

SPY, GLD and TLT are all forming down-trends. They are all investible, as they are trading above the trading channel mid-point (M-Trend Level). Commodities have slipped below their well defined Up-Trend, which makes them un-investible for now.
The US Dollar has finally bounced from its oversold condition. It has now almost completely retraced towards its 50-day Moving Average. The S1 Level resides just above, forming strong resistance at $28.13. A break above this level would spell continued trouble for all asset classes, especially Gold, Commodities and rate-sensitive sectors (Tech, Growth, High-Beta). Our base case-expectation at this juncture is to see the Dollar turn lower, towards its lower channel trend-line.

We are constantly checking for a break in the current negative correlation regime between the US Dollar (white) and every other asset class, combined (orange). There is no meaningful such break as of yet.
The combined asset classes have pulled back from recent highs. As the dollar bounced from oversold conditions, so did every other asset class retreat from overbought. We are still waiting to see the ultimate conclusion of the move, but so far it seems the dollar’s advance is limited. Therefore, we suspect there may be limited downside for the combined asset classes, as our analysis suggests the tide is turning (not in favor of the USD).
“We are not out of the woods just yet” when it comes to this bearish market environment, as the US Dollar is still significantly negatively correlated to everything else. This correlation will probably turn positive when Central Banks will get less attention from traders and investors.

Enterprise is targeting both equities and treasuries for exposure. TLT has triggered a BUY Signal last week, so the position has been initiated (albeit at a high price). A consolidation of SPY above the 403 level would eventually trigger a BUY signal there as well, and would lead to a complete allocation for the model.
The Enterprise Strategy

Enterprise, our most conservative model, is entering the week with holding a 20% long treasuries position and 80% CASH.
Since this model only trades 4 asset class ETFs, we use it to judge overall portfolio positioning.
Equities are targeted for exposure at 48% of portfolio value, via SPY ETF. This is a MAJOR bump from the previous allocation target (17%).
SPY is still on a positive MACD Signal. We need to see a SELL signal occur first, followed by a period of consolidation above $403 in order to trigger the BUY.
Cash reserves (USD) are currently at maximum.
2. Sector / Industry Selection
The next step in creating our portfolio positioning is to break down each broad asset class into more granular groups of assets. This will help us understand which pocket of the market is outperforming or underperforming and make our selection accordingly.
Since Equities are an investible asset class, we’ll take a look at how different Factors are performing and check for any notable opportunities.

The Factors table has a couple of overbought positions, with eye-popping recent performance. MDY is standing out from a technical perspective, as well as a fundamental one (Mid-Caps are a benign factor, it’s rare to see such a strong showing from mid-capitalization stocks). In any case, the outperformance of broad market factors (MDY, SLY, RSP) is a positive sign for the equity market because it shows participation is broad.
However, at the present time, these factors, along with Value (IVE) and International Developed Stocks (EFA) are extended and due for a pullback. Such a pullback has manifested in Emerging Markets Equities (EEM), as the rise in the US Dollar has squeezed positions there.
Notable strength comes from previously lagging sectors like QQQ and IVW, which are now showing signs of life.
From a value perspective, there is only one sector that we find bargains in: the Momentum Factor ETF (MTUM). So called “Momentum” stocks are those that have previously shown market leadership and strong price performance. Usually, it is these stocks that lead the market higher. Not in January of 2023! This has been a laggards market so far.
Here’s how we stand on the Sectors front:

On the sectors side, the overall picture has improved from last week. Defensive sectors (Utilities - XLU, Staples - XLP, Healthcare - XLV) are showing downside deviations. As risk-taking is embraced, former 2022 laggards (Transports - XTN, Tech - XLK, Communications - XLC) are surging.
There are currently no obvious opportunities for trading purposes. The big question for 2023 is weather we will see continued performance from lagging sectors, or if, eventually, the former winners will prevail yet again.
For now, relative value is found in sectors like Energy, Staples, Healthcare. Most stocks that are correlated with the other sectors tend to have priced in all of the upside at this point (leaving only risk on the table and little reward for investors).
Taking all of these into account, Nostromo will apply the same allocation logic as Enterprise. It will simply buy SPY on the next available signal, not being able to identify a clear favorite amongst Sectors and Factors.
The Nostromo Strategy

Nostromo, our tactical allocation model is starting the week by holding a long bonds position in TLT.
On the equity allocation side, Nostromo will aim to buy SPY on the next available BUY signal.
For more info about how Nostromo targets sectors or factors within a broader asset class, read this article. The first part sheds some light on the selection process going on in the background.
3. Individual Stock Selection
This week, we will run a completely custom screener. The point is to find quality stocks that have lagged the current rally for no other reason other than the market’s ignorance. Eventually, they are prone to attracting fund flows once short squeezing loss-making meme stocks goes out of style again.
Piotroski F Score => 6; this ensures Quality
Operating Leverage > 1 ; shows a solid business model, with revenue growth that flows to the bottom line
Sharpe Ratio > 0; decent risk-reward
Z-Relative < 0; stock underperforms its benchmark ETF
The screener outputs 136 stocks that can be further broken down by the sector correlation drop-down menu. Technology and Industrials stand out as the sectors with most companies (including AAPL, CSCO, DELL, QCOM), while for Consumer Discretionary (XLY) there are only 3 that make the list (CSL, EW, PCTY).
This speaks volumes to the state of future sector leadership as well (Discretionary appears to be VERY frothy).


Using our Fundamentals Explorer, we suggest researching names that stand out to you. We have generated a series of stock reports that you can access via the Stock Report Page: UNH, ENPH, ABBV, NXST, ADM, GOOG, CORT, PLAB, PXD.
Use the “Value Target” associated with each name to place an alert with your broker. If the stock would get to that price, consider initiating a long position (as long as the fundamental thesis holds).
The Horizon Strategy

Horizon will increase its overall exposure to equities and will buy shares for each position so that the portfolio will rebalance at an equal weight.
The increase in exposure is significant, from 17% to 48%. Each stock position will gain an average of 3% value.
Exposure to treasuries will also be increased slightly.
This model has performed poorly as of late. It’s equity curve is more related to the Momentum Factor ETF than SPY. As we discussed above, Momentum has lagged the broader market.
4. Market Environment
The next step in our process is to take into account the type of market environment that we are currently trading in. For these purposes we use the Market Internals and the Market Fundamentals Instruments. Comments on the overall state of the market can usually be found in our Weekly Preview Article.
595 stocks. That’s how many we need to see maintain their 200-day Moving Averages (dotted line) to make sure we are getting a positive consolidation in the market. That’s the number we find associated with the previous peak in the market (November 2022).
From a Sigma Score perspective, SPY is getting ahead of itself here. It is registering a 1.24 Sigma deviation, versus the average stock’s 0.67 deviation. This tells us that a pullback for the main index is in order.
Otherwise, the market’s structure looks bullish to us so far.
Bullish Signal long term in Stocks trading above their 200-day Moving Averages (Bearish Short Term due to Sigma Score)

The bullish divergence continues in terms of Z-Score as well (the Z-Score measures how many standard deviations a certain reading is above or below a computed trend). The average for the broad market is 0.43 (0.29 last week), while SPY’s is 0.29 (-0.05 last week). The gap has closed recently, but the overall picture is still bullish.
Bullish Signal in Market Internals Z-Score (deteriorating recently)

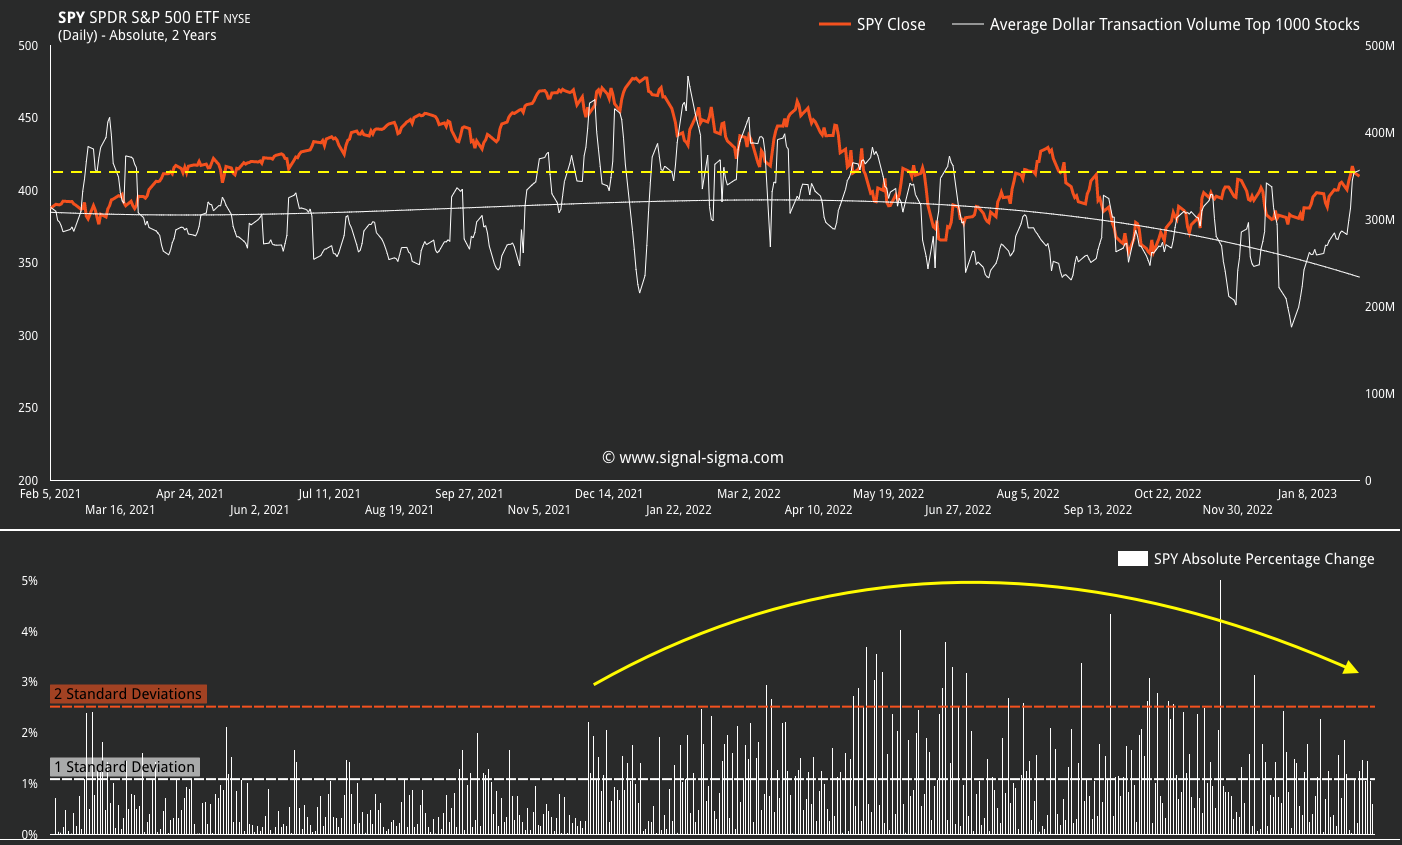
Dollar Transaction Volume has surged on the recent rally. Volatility has subsided. It’s too early to call for a change in trend, but we recognize the improvement in both metrics. As long as volume remains elevated, we should expect lower volatility to accompany market movement.
If volume were to suddenly evaporate, then that would be a major red-flag for risk-taking. We suspect this instrument will warn us before the next round of weakness in the market.
Mixed signal in Average Dollar Transaction Volume and Volatility
5. Trading in the Sigma Portfolio
After reviewing all of the above factors, it’s time to decide on the actual investing strategy for our real-life portfolio.
First of all, we will take an average of CASH position sizing from all of our models. This will come down to roughly 63%, with a minimum and maximum of 31% and 80% respectively. Our models are aligned in terms of bond market exposure for now. Horizon is the only model with equities in composition, since it does not wait for any kind of signals in order to execute.


The Sigma Portfolio is overweight bonds at the current juncture. We hold a 21% position in TLT, as well as a 4% position in HYG (high yield corporate bonds). We plan to eventually get this allocation to 35% of portfolio value.
Today, we are swapping some generic momentum positioning for 2 individual stocks that we have identified in our screening and modeling process. The reason we are closing MTUM is because these stocks are highly correlated with MTUM anyway, so there is no change in overall exposure.
Executing the order at today’s market close:
SELL 100% MTUM (Close Position)
BUY 3% UNH (Initiate 3% Position)
BUY 2% ADM (Add 2% to ADM Position)
We have readied a list of target stock positions in the event we will get the consolidation in equity markets. For now, our short-SPY hedge position (SH) will remain in place.
We won’t be adding to commodity related positions (DVN, PXD) for now, as the overall asset class is performing poorly. We’ll wait for USD weakness to manifest clearly.
The Sigma Portfolio’s allocation will be 20% Long, 10% Short and 44% Cash.
Andrei Sota