Portfolio Rebalance / March 07
Following the Signal Sigma Process
Tuesday is the day when all of our strategies rebalance their asset class holding weights. The approach to this article follows the step by step process described here.
If you didn’t get a chance to test it yet, the new Valuation Wizard Instrument is now available! Fundamental Explorer got a massive speed bump as well!
This week features Nostromo slowly adding to exposure almost every single day since last week’s positioning update. It’s an interesting development to watch, since Nostromo’s tactical nature meant the model stayed almost 100% allocated to cash for most of 2022. It simply could not find the right types of setups that would allow it to gain exposure to anything else other than cash. The model is also greatly diversified and in the context of a market breaking out higher, this kind of breadth is a bullish indicator.
Asset Class Allocation
The first step in determining optimal portfolio positioning is taking a look at the performance of the main asset classes, and determining which are suitable for investment. The Asset Class Overview Instrument gives us a clear macro picture.

All asset classes are investible this week, as Equities bounce off key support, Treasuries do NOT break down further and Commodities re-enter the technical channel. Gold has bounced as well, but there is no fundamental change there.
The US Dollar is testing the all important S1 Level ($28.21), which has provided strong support and resistance previously. This consolidation is fully expected, as the USD got extremely overbought previously. As the USD works off it’s overbought condition, the outcome of this re-test will be a tell-tale sign of any recovery within the broader stock and bond market. The Employment Report at the end of the week will most likely prove to be the catalyst of a more significant move either way.

We are constantly checking for a break in the current negative correlation regime between the US Dollar (white) and every other asset class, combined (orange). There is no meaningful such break as of yet, but there was an interesting development on this front last week (circled).
Within the larger (and more meaningful context) of an inverse correlation, last week’s price action did NOT show the same pattern. Multiple asset classes rose, without the dollar weakening as expected. Is this the start of a positive correlation pattern or is it just a temporary anomaly? While it’s too early to tell, we’ll chalk up this development in favor of the bulls (the cash-is-trash type of bulls).

Our strategies seem to be sniffing this potential change, and we are catching up similarly in the Sigma Portfolio. But first, let’s see what our macro-focused model is doing.
The Enterprise Strategy

Enterprise, our most conservative model, is entering the week 100% long CASH.
Since this model only trades 4 asset class ETFs, we use it to judge overall portfolio positioning. By sitting in cash, the strategy implies continued upside for the US Dollar as an asset class.
However, some trading is bound to happen soon, as multiple BUY signals are close to triggering.
Equities are targeted for exposure at 48% of portfolio value (up from 17% last week), via SPY ETF. The position will be filled at the next available BUY signal. This could be a MACD crossover, if the current consolidation phase is successful.
The model is aiming to allocate to treasuries up to a 41% portfolio value (up from 14% last week) via TLT ETF. The next MACD crossover or Williams %R reflexive bounce signal could be the trigger for this move.
Cash reserves (USD) will be kept at a maximum, 100% in the meantime.
2. Sector / Industry Selection
The next step in creating our portfolio positioning is to break down each broad asset class into more granular groups of assets. This will help us understand which pocket of the market is outperforming or underperforming and make our selection accordingly.
Since Equities are an investible asset class, we’ll take a look at how different Factors are performing and check for any notable opportunities.
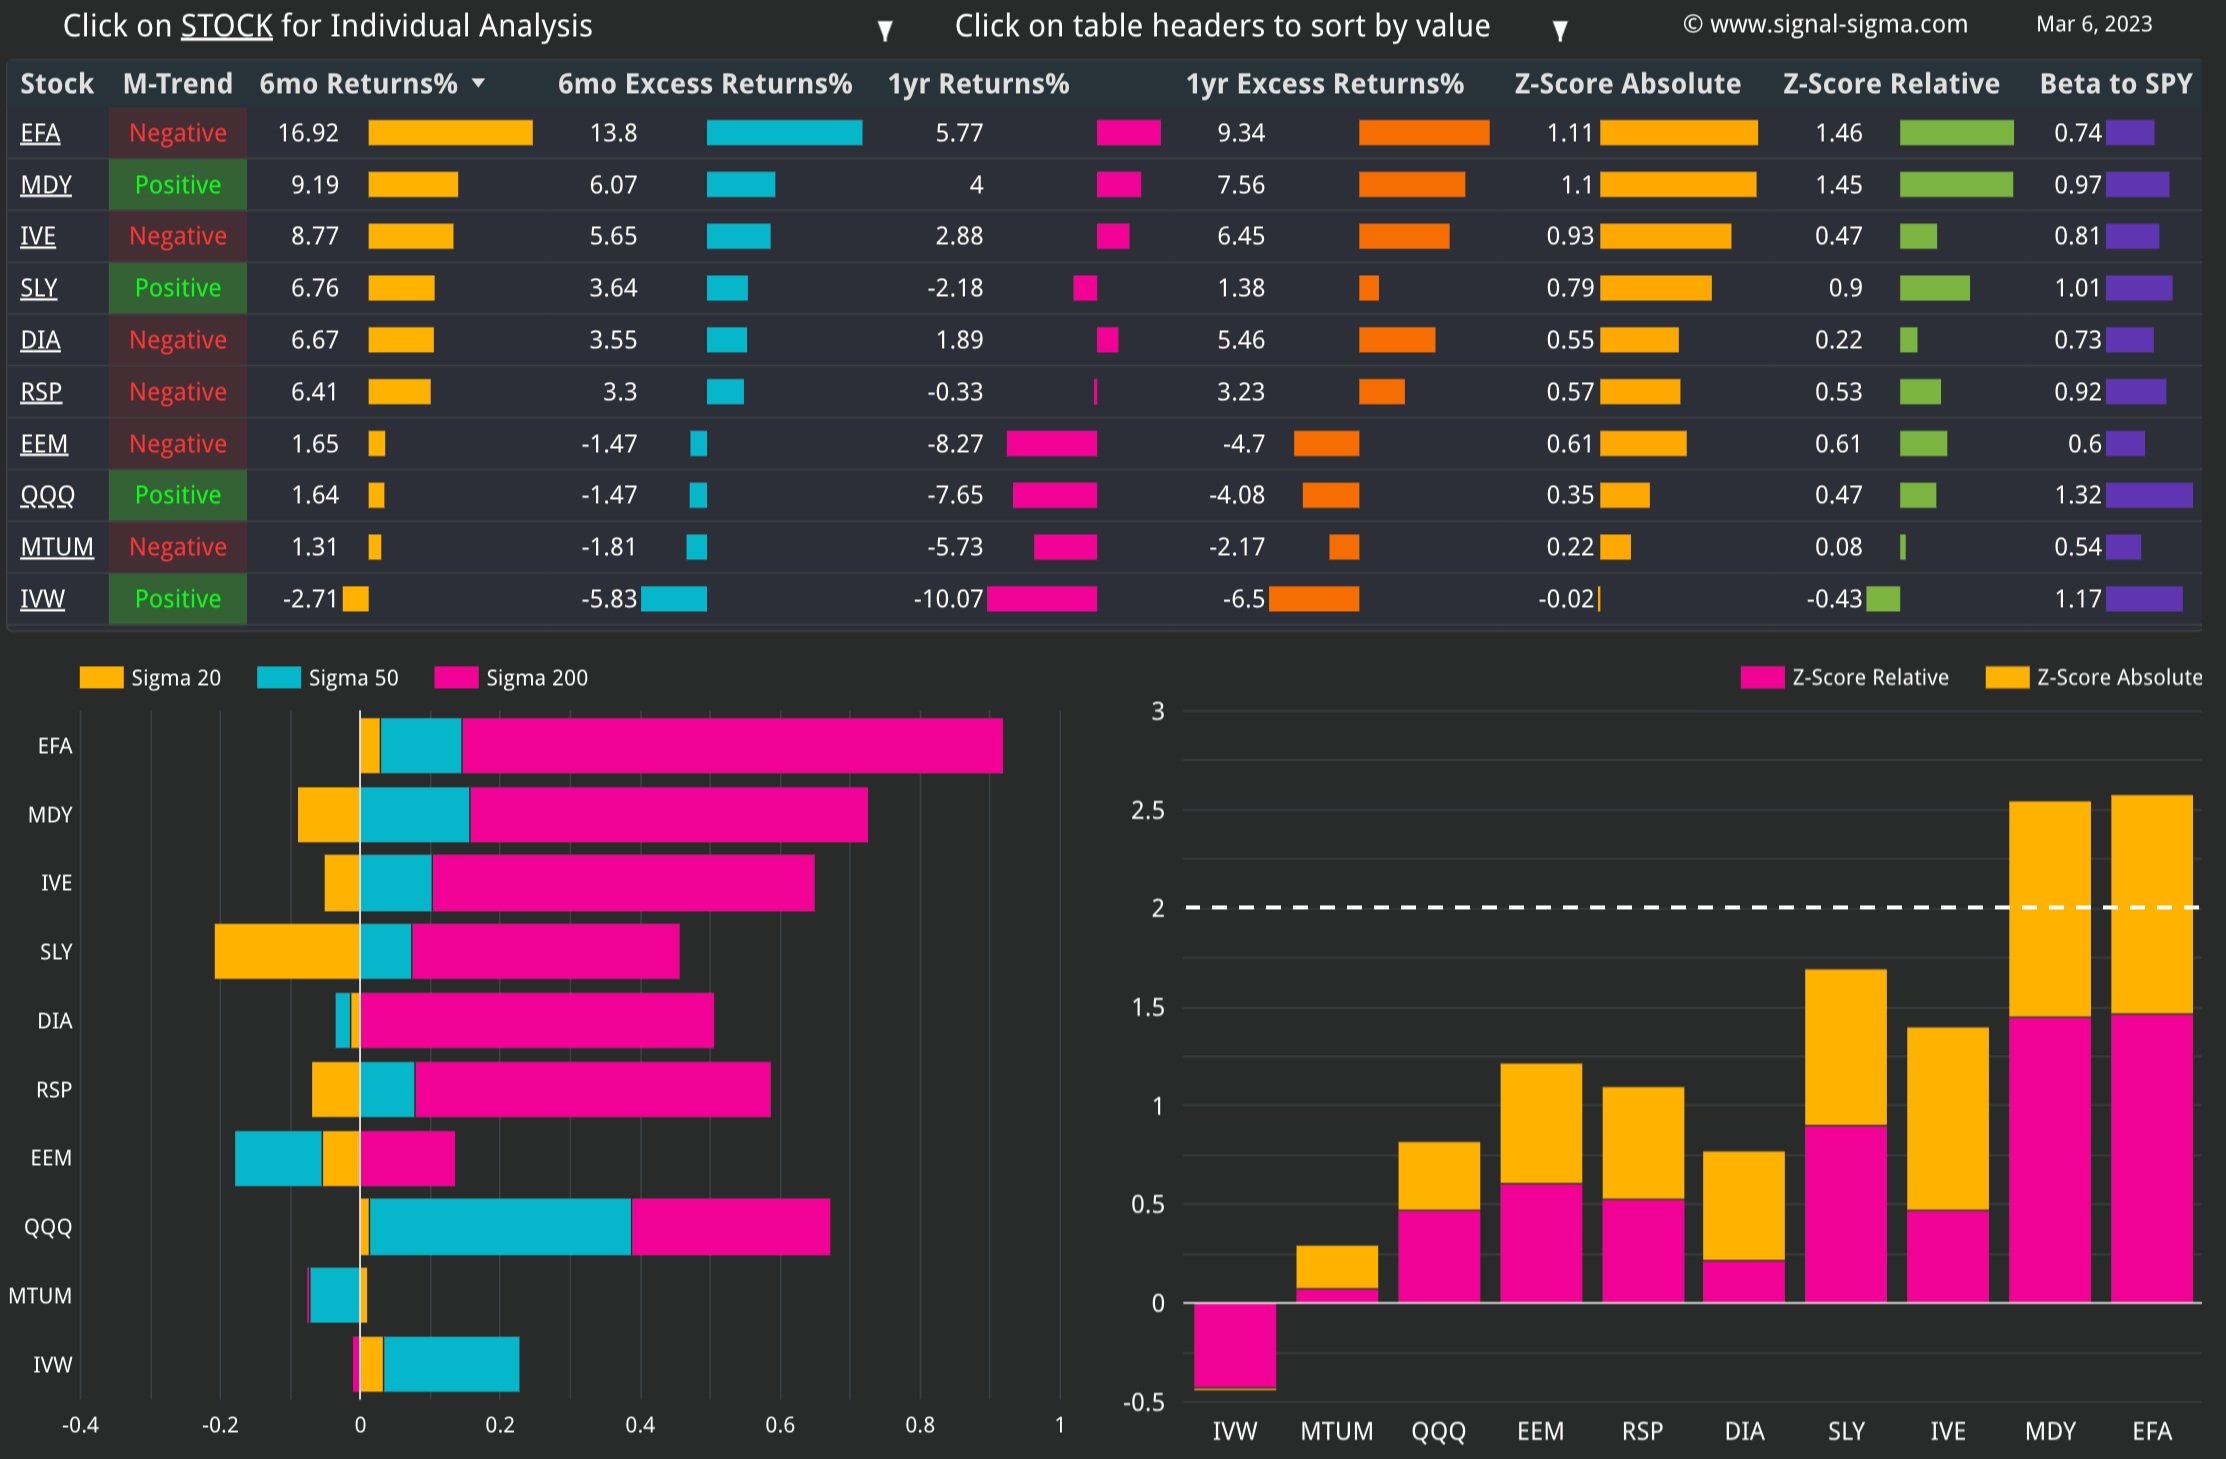
With the exception of IVW (Growth), all equity factors have been able to hold their 200-day moving averages. The same exception applies on the Z-Score scale as all factors are now registering positive Z-Scores on an absolute AND relative-to-SPY basis. This formation is undeniably bullish.
By using our proven selection criteria (Z-Relative > 0, while Sigma 50 < 0), the following factors stand out as notable opportunities:
MTUM (Momentum Factor ETF)
EEM (Emerging Markets ETF)
DIA (Dow Jones ETF)
Notably, Mid-Caps (MDY) and EFA (Foreign Developed Markets) are still significantly extended and probably have limited upside from this point on. From a relative-to-SPY standpoint, the DOW appears to be better positioned than either MTUM or EEM. There is a clear performance gap that could be closed, while Momentum seems to be struggling as a selection factor.
Here’s how we stand on the Sectors front:

Curiously, sectors are a mixed bag in quite the stark difference to the more uniform factors table. Industrials (XLI) are still significantly overbought, and performance has been struggling recently. This is not surprising given the highly extended upside that exists currently. Basic Materials (XLB) are following the same pattern mostly, but the upside extension is less extreme.
On the flip side, defensive sectors like Healthcare (XLV) and Utilities (XLU) are highly deviated to the downside and could do some catching up if the macro outlook deteriorates. All of the other sectors fall into a mixed bag, with no significant opportunities standing out. Similarly to the behavior of the US Dollar, the way defensive sectors will perform relative to the broad market will tell us if this rally has legs. Currently, XLU, XLV, XLP are testing the relative lower bounds as charted below, and could benefit from a risk-off rotation.


Taking all of these into account, Nostromo will select all of the outperforming factors for allocation: MTUM, EEM, DIA. The position in Momentum (MTUM) will be increased at today’s close.
On the treasuries side, last week’s positioning stays the same: MBB, LQD, IEI, HYG.
The Nostromo Strategy

Nostromo, our tactical allocation model, has been slowly adding to exposure in the last couple of days.
On the equity allocation side, Nostromo has bought MTUM at 3% weight, and is now increasing the position to 17%.
DIA and EEM positions that currently make up 5% and 3% respectively, will also be increased on their respective BUY signals.
On the treasuries side, Nostromo has bought a 3% position in MBB, and is looking to allocate up to 41% to the other bond classes.
For more info about how Nostromo targets sectors or factors within a broader asset class, read this article. The first part sheds some light on the selection process going on in the background.
3. Individual Stock Selection
This week, we would like to see what happens if we combine a Horizon-type Momentum + Quality screener, with the factor constraints identified by Nostromo. To sum up, here is the screening criteria:
Piotroski F Score => 6; this ensures Quality
6 month & 1 Year Absolute Returns > 0; a basic momentum requirement
Sharpe Ratio > 1; very favorable risk-reward
Z-Relative > 0; stock outperforms its benchmark ETF
MACD Trend is Positive; medium term momentum is trending up
Allowed Factors: MTUM, DIA, EEM (Nostromo requirement)
The screener output is pretty short. Below the table, we have included a correlation scatter plot, with DIA on the X-axis and MTUM on the Y-axis.
The stocks in the dotted circle stand out: FIX, REGN, CIVI, KOS, KBR.
We can use the Fundamental Explorer instrument to take a deep dive into their financials. Then, use the Valuation Wizard to generate a Price Target, and see the target on a chart using Technical Analysis. The workflow is now complete!
The Horizon Strategy

Horizon will add exposure to all positions this week.
The strategy increases overall equity exposure from 17% to 48%.
Bonds positioning will go from 14% to 41%.
Rebalance will only occur at the individual securities level, in order to bring each at target weight (4.8% each).
The CASH position will decrease from 69% to 11%.
This model has performed poorly as of late. It’s equity curve is more related to the Momentum Factor ETF than SPY. Momentum has lagged the broader market, but may be seeing a pick-up in relative performance, as discussed above.
As an aggressive equity exposure model, Horizon has got trapped in repeated “bear-market rallies”. Eventually, those will end sooner or later.
4. Market Environment
The next step in our process is to take into account the type of market environment that we are currently trading in. For these purposes we use the Market Internals and the Market Fundamentals Instruments. Comments on the overall state of the market can usually be found in our Weekly Preview Article.
595 stocks. The market has held that level remarkably, as the advance in market breadth continues. As highlighted on the chart, the succession of higher lows since September is confirming a rather bullish market composition.
From a Sigma Score perspective, SPY is above overall market (0.47 vs 0.17). This is what we call “the market getting ahead of itself”. It also means there is a negative disparity starting to form between the average stock’s recent performance and the market. This signals a possible market pullback in the next couple of weeks (retest of a retest?).
On a longer term basis, the breadth numbers look solid, but SPY needs to trade more in line with the average stock.
Bullish Signal long term in Stocks trading above their 200-day Moving Averages (Bearish Short Term)

In terms of Z-Score divergence, there is no notable difference this week. SPY is at 0.26, while the market is slightly above, at 0.29. The difference is not notable, with SPY and the market trading harmoniously.
Neutral Signal in Market Internals Z-Score

Dollar Transaction Volume has dropped from elevated levels and is now nearing the average. As the consolidation works off some overbought conditions in the market, we would like to see volumes go even lower (bullish). For the moment, volume remains in the same area as last week. Not great, not terrible. Unfortunately, there is not much info that we can tease from this indicator now.
Mixed signal in Average Dollar Transaction Volume and Volatility

5. Trading in the Sigma Portfolio
After reviewing all of the above factors, it’s time to decide on the actual investing strategy for our real-life portfolio.
Our models are starting to look alive, and reflect their risk profiles. Allocation is moving away from cash, but Enterprise needs more “convincing”. We would be reluctant to chase Horizon at this moment, since it repeatedly got caught in multiple bear-market rallies. But the model might be on to something with that large bonds allocation!
To start, we will take an average of CASH position sizing from all of our models. This will come down to 61%. While still technically higher than our current allocation, we must account for the fact that Enterprise will most likely buy bonds soon, and this allocation will come WAY down. Defensive positioning due to the presence of Healthcare, Energy and Momentum stocks helps bring the beta of our portfolio down as well.


As discussed in our previous articles, our trend-following models are inefficient in a mean-reversion environment. We might see another situation where chasing equities proves to be a bull trap, so we won’t follow Horizon’s lead outright.
Nostromo’s approach is much more sensible. We will factor in the correlations to its selected ETFs. At the time of this writing, the BUY signal for TLT will trigger, most likely determining Enterprise to trade a huge chunk of bonds. In order to align with this expected allocation, we shall buy bonds as well in the Sigma Portfolio, adding to the TLT position.
Out of the companies that we have individually modeled, Microsoft is looking attractive and safe at current prices. It is also reasonably well correlated with the DOW, and has an attractive dividend. We will add a starter position in MSFT as well, in order to bring our net-equity allocation more in line with Nostromo.
The Sigma Portfolio will be 20% net-long on the equity side (25% Long / 5 % Short), with 34% allocated to treasuries (4% Corporate Bonds, 30% Long Term Treasuries). 35% of the portfolio is net CASH, providing flexibility.
Andrei Sota