Portfolio Rebalance / March 2
Following the Signal Sigma Process
Tuesday is the day when all of our strategies rebalance their asset class holding weights. The approach to this article follows the step by step process described here.
In a week with little notable economic releases, only headlines and algorithms will dictate the near term direction of asset prices. Transaction volume has declined notably, and we take this to be a bullish development in the current context.
Asset Class Allocation
The first step in determining optimal portfolio positioning is taking a look at the performance of the main asset classes, and determining which are suitable for investment. The Asset Class Overview Instrument gives us a clear macro picture.

Equities have held up well during the recent selling pressure and continue to be investible; Gold remains highly overbought and historically deviated to the upside; Treasuries have also held up well; Commodities have rebounded to a certain extent recently, but not enough to make the asset class investible again;
The US Dollar has clearly bounced off the S1 level, and is headed lower to its lower trend-line and S2 level, near $27 on UUP. This dynamic would most likely bode well for every other asset class, especially commodities and emerging / foreign markets.

We are constantly checking for a break in the current negative correlation regime between the US Dollar (white) and every other asset class, combined (orange). There is no meaningful such break as of yet, and the divergence we have noticed in the last couple of weeks has subsided.
Conclusion: it is still an environment where the Dollar is trading against “everything else”, symptomatic of a bear market.

Enterprise maintains its allocation from last week, with slightly modified targets for future allocation.
The Enterprise Strategy

Enterprise, our most conservative model, is entering the week 42% long Treasuries, and with 58% in CASH.
Since this model only trades 4 asset class ETFs, we use it to judge overall portfolio positioning.
Equities are targeted for exposure at 52% of portfolio value (same as last week), via SPY ETF. The position will be filled only if SPY manages to close above the M-Trend level of $394, and a BUY signal then occurs.
While this has actually happened last week, a close below the M-Trend level triggered a STOP-LOSS, which led to the removal of the SPY position in Enterprise.
The model’s treasury allocation is overweight for the time being, and is meant to be reduced on the next available SELL signal (from 43% currently to 27%).
At 57% Cash is still the dominant position for this model.
2. Sector / Industry Selection
The next step in creating our portfolio positioning is to break down each broad asset class into more granular groups of assets. This will help us understand which pocket of the market is outperforming or underperforming and make our selection accordingly.
Since Equities are an investible asset class, we’ll take a look at how different Factors are performing and check for any notable opportunities.


We have included tables for this week and the prior 3 weeks in order to help you compare developments (click on the arrows or thumbnails to cycle through the tables).
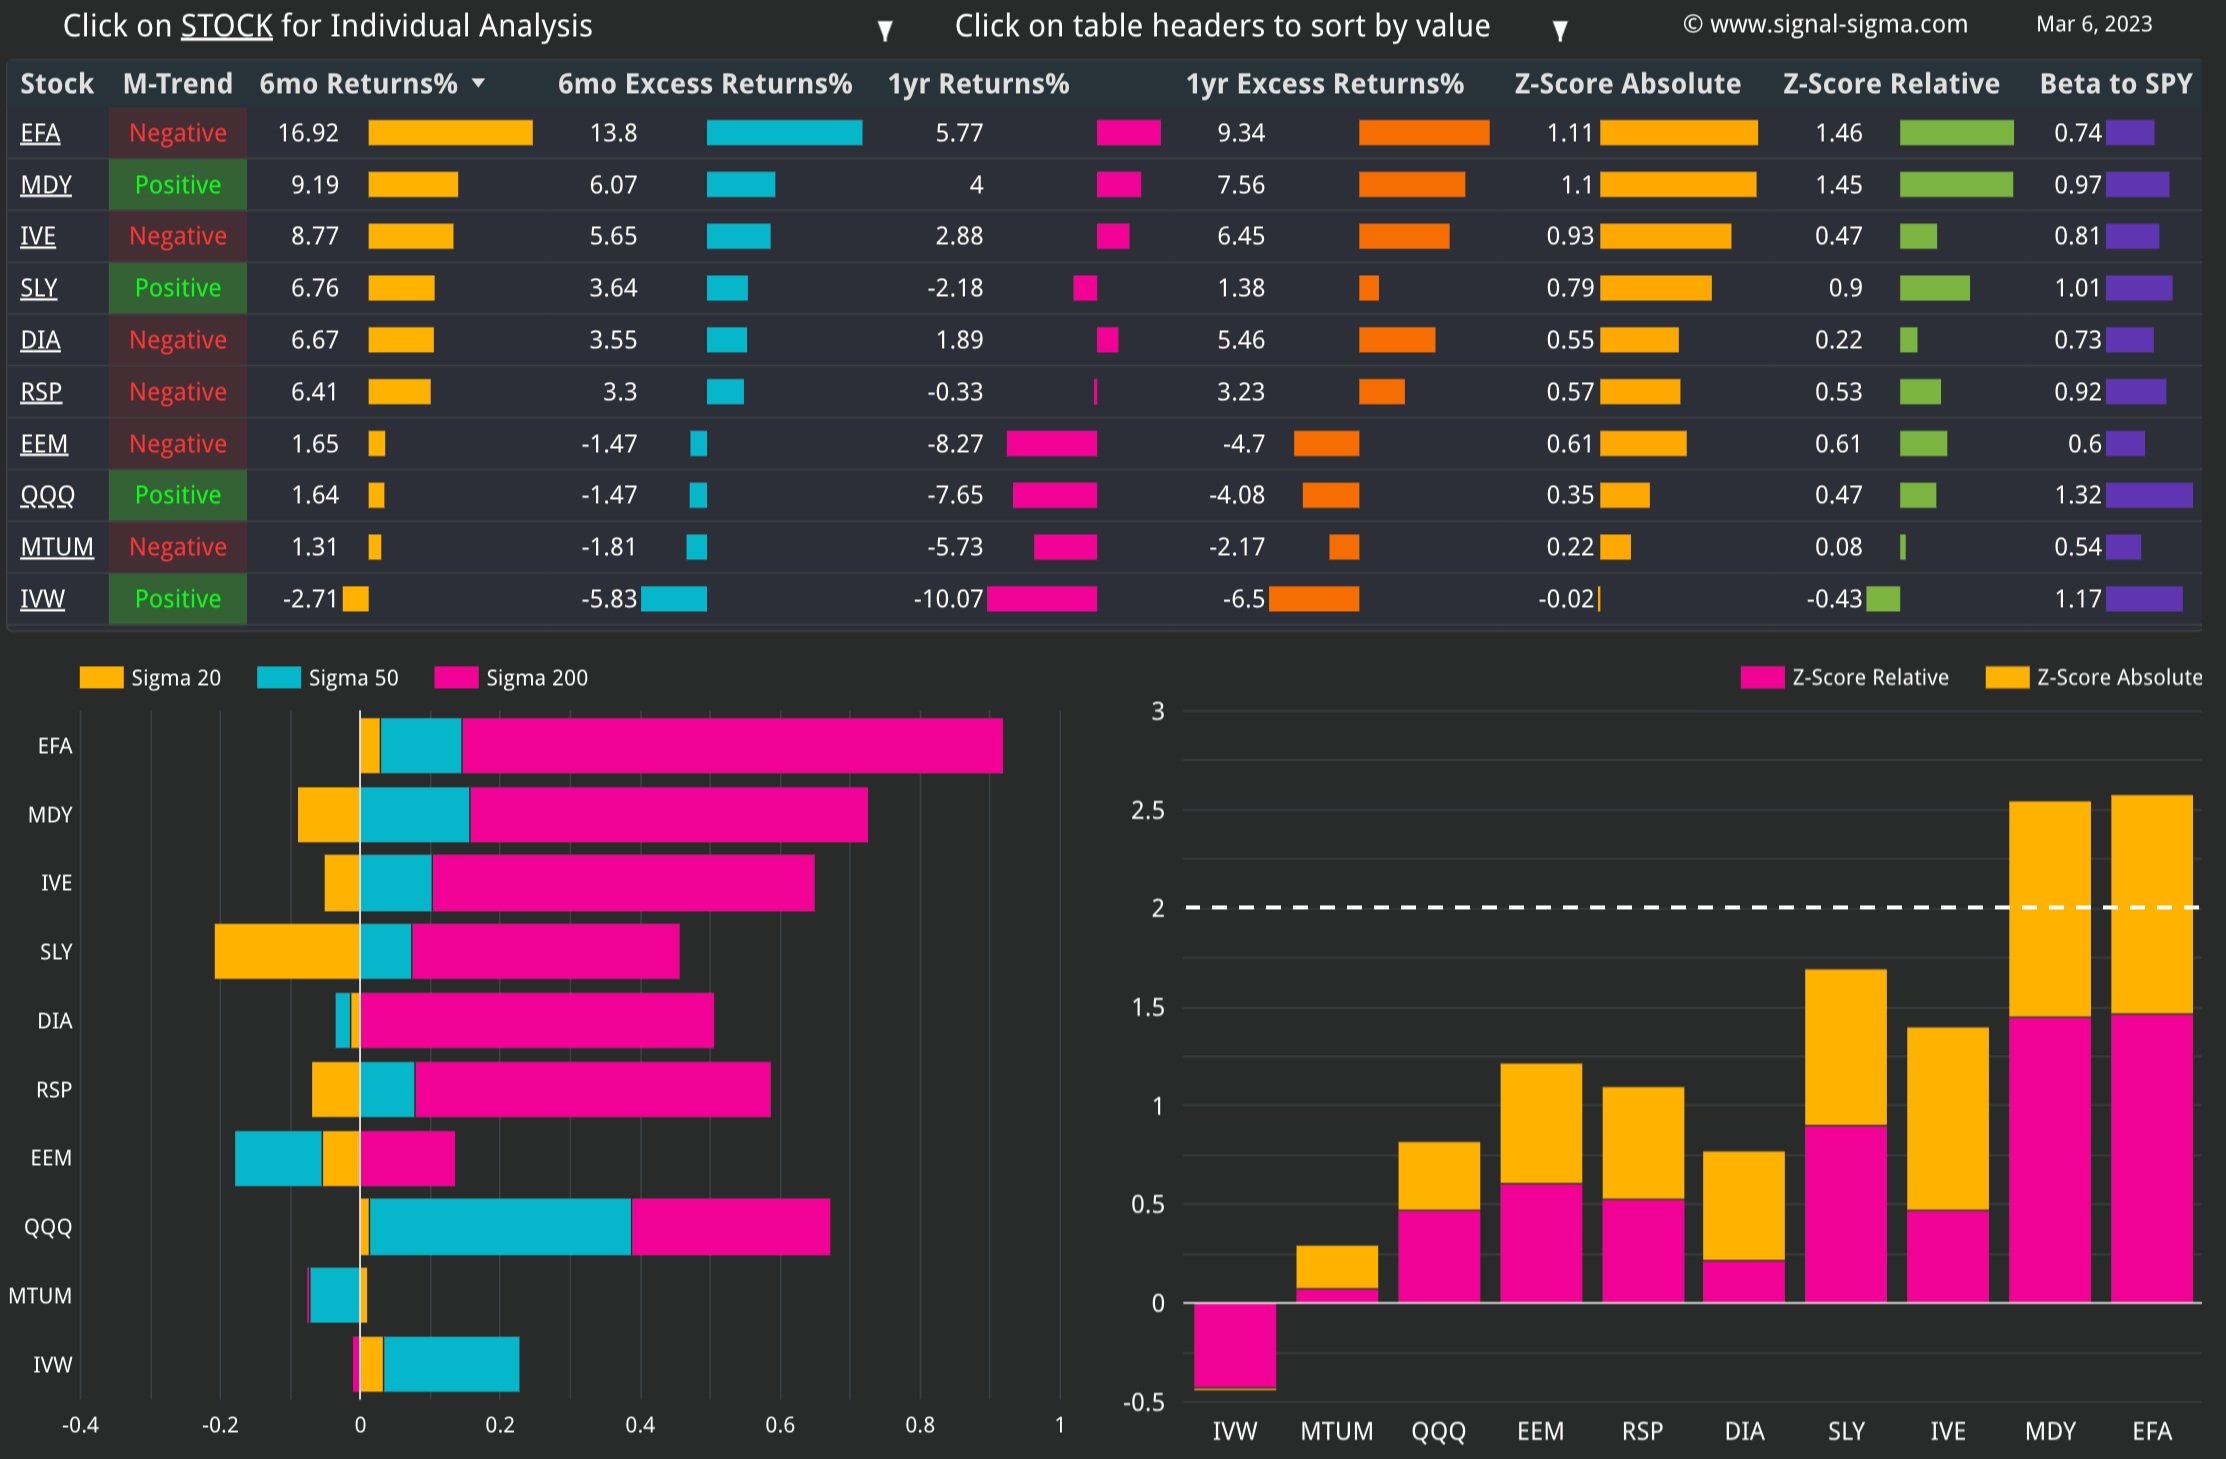
QQQ (Nasdaq) and EFA (Developed Foreign Markets) are sitting at the top of the Z-Score table comfortably and arguably overbought. Emerging markets (EEM) are also performing well and are not yet overbought.
The “middle of the market” comprised of MDY (Mid-Caps), RSP (Equally Weighted SPY), SLY (Small Caps) are trading below all key moving averages and slightly under-performing SPY. This is a natural predicament given the fact that smaller companies are more vulnerable to a more severe economic shock. There is little change from week to week in this regard.
By using our proven selection criteria (Z-Relative > 0, while Sigma 50 < 0), the following factors would make good investment candidates for a technical play:
The rest of the factors seem to be in a transition process, where the market is still digesting the impact of rate hikes and potential economic fallout from the banking sector crisis.
Charts Emphasis:
The Momentum Factor (MTUM) is still lagging the broad market, but it seems to now have stabilized near previous lows. MTUM is now trading above its M-Trend level. The Equally-Weighted S&P500 (RSP) is looking like a strong relative performance rebound contender. Nasdaq (QQQ) has reached relative performance levels more commonly associated with reversions in relative performance.


Here’s how we stand on the Sectors front:


Like in the factors category, we have included the last 3 weeks of tables as well.
The financial sector (XLF) remains under pressure despite the recent rebound. It is joined in the lower rungs of under-performance by Real Estate (XLRE) and Utilities (XLU). Energy has rebounded from the limit of its technical channel, but remains under pressure. Similar to QQQ, XLK (Tech) is out-performing to the extent that a pull-back is entirely expected.
By using our proven selection criteria (Z-Relative > 0, while Sigma 50 < 0), the following sectors would make good investment candidates for a technical play:
XLI (Industrials)
Defensives (like Healthcare - XLV) are barely holding on to their longer term relative out-performance trend, Industrials (XLI) are no longer overbought, and Tech (XLK) is off the charts when compared to SPY. A rotation from XLK to more defensive sectors would surely make sense at this juncture.


Taking all of these into account, Nostromo will select the out-performing factors for allocation: EFA and EEM, along with a contingent of treasuries.
On the bonds side, MBB is slated for reduction, while LQD is preferred to TLT for exposure.
The Nostromo Strategy

Nostromo, our tactical allocation model, has successfully allocated to equity risk exposure via 2 Foreign Market ETFs.
The strategy has built its 53% stocks position using EEM (Emerging Markets ETF) and EFA (Developed Foreign Markets ETF).
Both positions are slated for slight reduction in the event sell signals trigger, but nothing material.
On the treasuries side, Nostromo plans to allocate towards LQD (Investment Grade Corporates) on the next BUY signal. If the opportunity presents itself , it shall sell MBB.
For more info about how Nostromo targets sectors or factors within a broader asset class, read this article. The first part sheds some light on the selection process going on in the background.
3. Individual Stock Selection
This week, we would like to screen for "Buy The Dip Opportunities”, using our specially designed screener. Here are the rules:
Regression Trend is Positive; the stock is trending up, on a 2 year historical window
Sigma 50 < 0; currently, the stock is trading below the level where it’s normally been trading relative to its 50-day Moving Average
Z-Relative > 0; the stock is outperforming its benchmark ETF
Furthermore, we would like to restrict the screener only to the RSP factor, as the relative performance to SPY is indicative of a potential rebound in these names.

ARCB, MTD, FLEX and H stand out to us from the screener output.
We can use the Fundamental Explorer instrument to take a deep dive into their financials. Then, use the Valuation Wizard to generate a Price Target, and see the target on a chart using Technical Analysis. If interesting, we will look for opportunities to add them to our portfolio.
The Horizon Strategy

Horizon has rebalanced positions to target this week. Overall allocation to each asset class has remained the same as last week.
This model has performed poorly as of late. It’s equity curve is more related to the Momentum Factor ETF than SPY. Momentum has lagged the broader market, and has reached previous-low levels.
As an aggressive equity exposure model, Horizon has got trapped in repeated “bear-market rallies”. Eventually, those will end sooner or later and this model will start performing closer to its historical metrics.
4. Market Environment
The next step in our process is to take into account the type of market environment that we are currently trading in. For these purposes we use the Market Internals and the Market Fundamentals Instruments. Comments on the overall state of the market can usually be found in our Weekly Preview Article.
465 stocks are trading above their 200-day Moving Averages. If we were to apply technical analysis to this chart, we would say that a “head and shoulders” formation is taking shape, which is usually a bearish signal.
Aside from that note, we would say that stocks in the broad market are holding up well, with breadth NOT deteriorating. Breadth has not improved either, however.
Neutral Signal in Stocks trading above their 200-day Moving Averages

The market is still fairly oversold, but no longer in “panic” mode. As a contrarian indicator, this instrument is flashing a BUY signal, although it has to be noted that it isn’t quite at the “Extreme Oversold” level that we have seen at the beginning of March.
Bullish Signal in Stocks Overbought / Oversold

In terms of Z-Score divergence, the bearish difference noted last week has subsided. The market is trading in-line with SPY right now, making this indicator neutral.
Neutral Signal in Market Internals Z-Score

Dollar Transaction Volume has rolled over below its polynomial average. This is a bullish signal in the context of a market in “correction” mode, telling us that buyers and sellers are almost done transacting at current prices. Since support levels have held, we would take this to mean “the current move is over”. Another bullish interpretation comes from volatility, which has been suppressed lately.
Bullish signal in Average Dollar Transaction Volume and Volatility

5. Trading in the Sigma Portfolio
After reviewing all of the above factors, it’s time to decide on the actual investing strategy for our real-life portfolio.
2 out of 3 models are aligned in their allocation. Enterprise and Horizon are in alignment for bonds exposure. Nostromo and Horizon agree on equities exposure. Nostromo and Enterprise have a similar CASH exposure.
To start, we will take an average of CASH position sizing from all of our models. This will come down to 39%, with 15% - 58% allowed. Equity exposure stands at 35% on average, while on the treasury side models average 26%. The average allocation makes a lot of sense at the moment, and we would lean on taking on more risk in both stocks and bonds. We’d underweight cash at the current juncture.


For today’s rebalance, we would like to add one equity position in the healthcare portion of the portfolio, and close the broad healthcare ETF position (XLV). The overall exposure to the sector remains intact, at around 10%:
SELL 100% XLV (Close Position)
BUY 4% ELV - Elevance Health - (Initiate 4% Position)
BUY 3% UNH - UnitedHealth Group - (Add 3% to Position)
Furthermore, we would like to increase our overall equity exposure to 53% in the Sigma Portfolio by adding RSP, due to its very attractive relative performance profile.
BUY 7% RSP (Initiate 7% Position)