/ July 17 / Weekly Preview
-
Monday:
N/A
Tuesday:
Retail Sales MoM (0.5% exp.)
Wednesday:
Building Permits (1.5M exp.)
Thursday:
Initial / Continuing Jobless Claims
Friday:
N/A
-
Monday:
N/A
Tuesday:
Bank of America BAC
Bank of New York Mellon BK
Charles Schwab SCHW
Hasbro HAS
Interactive Brokers IBKR
J.B. Hunt Transport Services JBHT
Lockheed Martin LMT
Morgan Stanley MS
PNC PNC
Wednesday:
Netflix NFLX
Tesla TSLA
Alcoa AA
ASML ASML
Goldman Sachs GS
Halliburton HAL
International Business Machines IBM
Kinder Morgan KMI
Nasdaq NDAQ
United Airlines UAL
Zions Bancorp ZION
Thursday:
American Airlines AAL
D.R. Horton DHI
Freeport-McMoRan FCX
Intuitive Surgical ISRG
Johnson & Johnson JNJ
Philip Morris International PM
SAP SAP
Friday:
American Express AXP
SLB SLB
Does Weak CPI Portend a Soft Earnings Season?
As Q2 Earnings Season gets underway, we’ll start by discussing last week’s activity. While the market cheered a soft inflation print, we can’t help but suspect that disinflation will show up in companies reports as slower than expected sales growth, reduced margins and profits. We do expect companies to broadly “beat” estimates, as the overall bar has been lowered substantially, however.
Depending on the particular company analyzed, the post-announcement reaction may carry more or less risk (we’ll cover a couple of the most important stocks releasing earnings this week at the end of the article, and show the relative risk-reward in a couple of snapshot valuations).
Either way, the overall technical backdrop of the market remains bullish. While we are now back in highly overbought territory, with “Extreme Greed” sentiment and a bullish MACD crossover, transaction volume and breadth signal weakness. It is the sort of weakness that we would like to speculate and use to increase risk exposure aggressively, if it materializes.
Analysts added to trader’s FOMO last week by eyeing all-time highs by year end in SPY. While this view aligns with our isolated levels, it is unlikely that we’ll get there in a straight path, without any notable corrections along the way (the 200-DMA resides some -10.5% lower than the last close, and the 50-DMA sits -4.83% lower, per the Risk Explorer Instrument). In any given year, a 5% to 10% correction is absolutely normal, and the more SPY “defies gravity”, the more likely this scenario becomes. The stock-bond ratio is pushing extreme deviations as well, suggesting a rotation to bonds would be wiser at the moment. Our SPY Analysis chart is busier than usual, but we’ll expand below.
SPY Analysis
The MACD has indeed triggered a BUY, but the crossover is occurring at an elevated level - this suggests that some upside exists, but it is limited;
We’ve laid out two possible technical scenarios on the chart:
Scenario A: we get a low volatility “grind” higher by year-end, with little in the way of drawdowns or fear (20% probability);
Scenario B: we’ll get a significant correction along the way - something that would seriously “shake” bullish confidence and substantially increase volatility; this correction needs to violate a couple of key levels in order to achieve these goals and reset sentiment to “Fear”; eventually, the market recovers to all-time highs by early 2024 (75% probability);
While oversimplified, these scenarios form the gist of short-term positioning. There is one more scenario not shown on the chart - a continuation lower from Scenario B, if the market does not find support in a correction (5% probability). While unthinkable at the moment, this scenario will appear to be much more likely in a correction that truly elicits “Fear”.
Supporting Scenario B (correction thesis) is the excellent track record of our contrarian positioning tool: the Market Internals Sentiment Instrument. At extremes, this indicator suggests taking the other side of the crowded trade (or at least checking your first impulse). The last 6 times this indicator recorded extreme positioning was an opportune moment to do the opposite of everyone else.

Our current setup heavily favors a rotation to bonds here. While FOMO has gripped the equity market, treasuries are mired in doom and gloom, with yields near recent peaks and a SPY / TLT relative chart at a very high deviation - another supporting factor for profit taking in equities.

With below average dollar transaction volume and continuing dismal participation (see Z-Score Divergence chart), this rally is hanging on the performance of a couple of stocks. If their earnings calls disappoint, so will index returns.

Relatively light transaction volume is not supportive of continued upside; we think that the next volume spike will occur on a fall in prices and increased volatility;

Comparing SPY’s Z-Score and the average Z-Score of the top 1000 stocks reveals a glaring gap; proof that participation is lagging from the broad market;

Shockingly bad: this is the combined price performance of stocks with a maximum Market-Cap of 1B, created with the help of our Fundamentals Screener; there’s not even a discernible technical “breakout” in Small-Caps, which are the most economically risky stocks;
The Risk / Reward Setup of the Leaders
Having established that index returns are entirely dependant on the performance of the “Leaders”, and that Market-Cap is the Nr. 1 predictive factor for returns at the moment, let’s assess the risk-reward set-up of the most influential companies reporting earnings this week. You can re-create the analysis by tweaking our assumptions in the Valuation Wizard Instrument.
Tesla (TSLA) - Price Target $227 / 12% - 23% EPS Growth
Our DCF Model works with the following assumptions:
Revenue Growth: 23%
Gross Margin: 22%
Operating Expenses % of Sales: 11%
Share Count Growth: 0%
EV / EBITDA Multiple: 30
WACC: 9%
Tax Rate: 21%


Unfavorable risk reward currently if assumptions are correct, for TSLA.
Johnson & Johnson (JNJ) - Price Target $174 / 4% EPS Growth
Our DCF Model works with the following assumptions:
Revenue Growth: 4%
Gross Margin: 67%
Operating Expenses % of Sales: 41.5%
Share Count Growth: 0%
EV / EBITDA Multiple: 12.5
WACC: 5.8%
Tax Rate: 21%


JNJ is showing a favorable risk-reward setup, with an 8% upside to our Price Target
Netflix (NFLX)- Price Target $511 / 7% EPS Growth
Our DCF Model works with the following assumptions:
Revenue Growth: 8%
Gross Margin: 39%
Operating Expenses % of Sales: 22%
Share Count Growth: 0%
EV / EBITDA Multiple: 8
WACC: 9.3%
Tax Rate: 21%

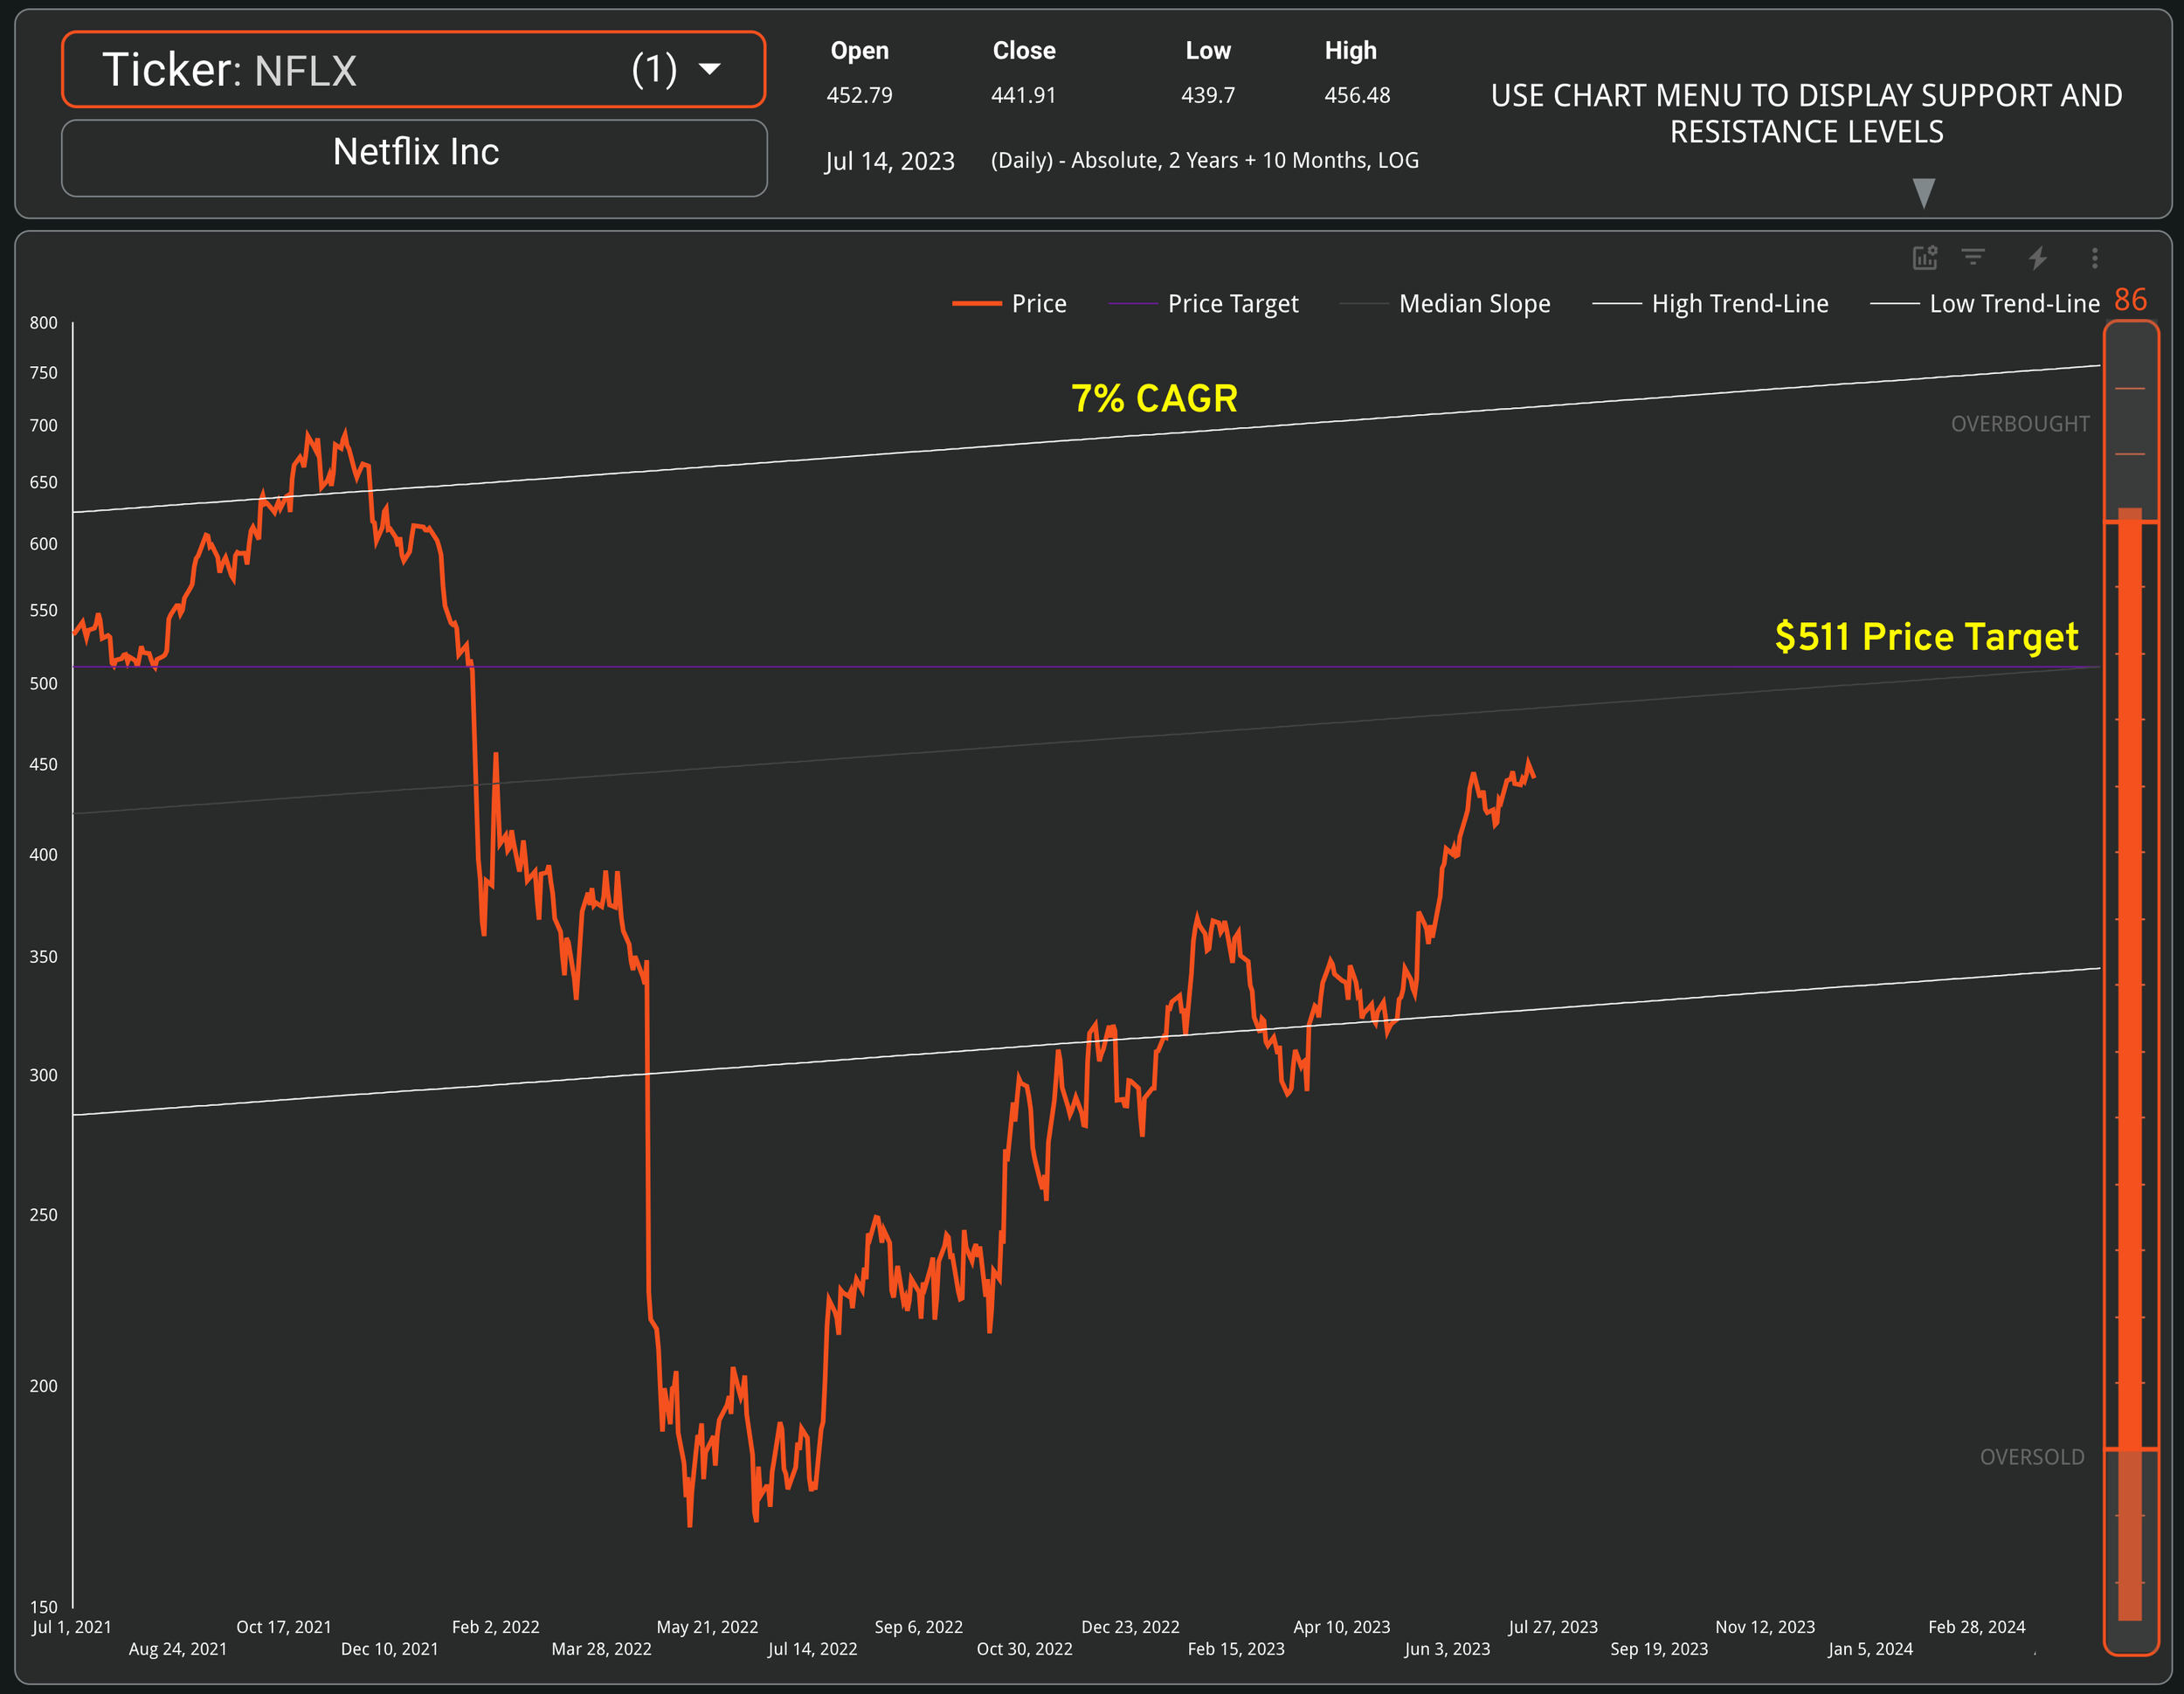
Some fundamental upside left for NFLX; if results are encouraging, there is scope for further rally to upper trend-line;
Our Trading Strategy
As you may have noticed, we’re fans of a wait and see approach relating to the equity market at this point. Our risk-reward analysis has produced all kinds of results for the leaders set to report this week. Tesla has fundamental downside, Netflix is balanced, while Johnson & Johnson carries positive risk.
For now, we remain underweight equity risk. This will protect our portfolio from more pronounced declines in the near term. While our performance is also taking a hit, we won’t let FOMO dictate our approach to the markets. We are waiting for a better opportunity to rebalance risk, add exposure and “catch up” in terms of performance as we move into 2024. We are getting paid to wait, courtesy of our generous allocation to bonds (that can also appreciate in value when a rotation occurs).
We’re watching the banks and Small-Caps spaces for opportunities in the near term - having taken a performance hit recently, these areas of the market seem well poised to rebound in “better than expected” economic conditions.
