Weekly Preview / October 24
Notable Events on our Weekly Watchlist:
Monday: China GDP Growth & Industrial Production
Earnings: CDNS, LOGI, ZION
Tuesday: N/A
Earnings: GOOGL, ADM, CC, CMG, KO, ENPH, GM, HAL, MSFT, RTX, SPOT, TXN, V
Wednesday: New Home Sales
Earnings: BA, BMY, F, HLT, KLAC, META, ORLY, STX, UPWK
Thursday: ECB Interest Rate, US GDP Growth
Earnings: AMZN, AAPL, AMT, CAT, DXCM, FSLR, GILD, INTC, MA, MCD, MRK, SPGI, SO, TWTR, WDC
Friday: Personal Income / Spending, Consumer Sentiment
Earnings: ABBV, CL, XOM, NEE
ETFs to watch: SPY, XLK, XLU, TLT
Earnings kick into high gear
Last week proved to be very hard to navigate for traders aiming to position for either a bullish or bearish scenario. After surging by 2.5% by Tuesday’s open, SPY finished lower by 2.63% on Thursday’s close, only to finish the week with a strong 2.65% rally into Friday. Overall, the market gained 2.47% on the week, but the volatility is certainly causing many market participants increasing duress. It seems like the eagerness to “buy-the-dip” is slowly eroding from investor’s mindset, as the strategy is no longer reaping the rewards it once did.
Nevertheless, the market was able to hold key support at SPY 360, and at the 20-day Moving Average. Friday’s rally should lift spirits for the bulls and put trend following systems on the path of sustaining the current upward move. From a purely technical perspective, there is still upside to the 50-day Moving Average of about 3.5%, and the long-term positive trend remains intact.
The 200-Week View
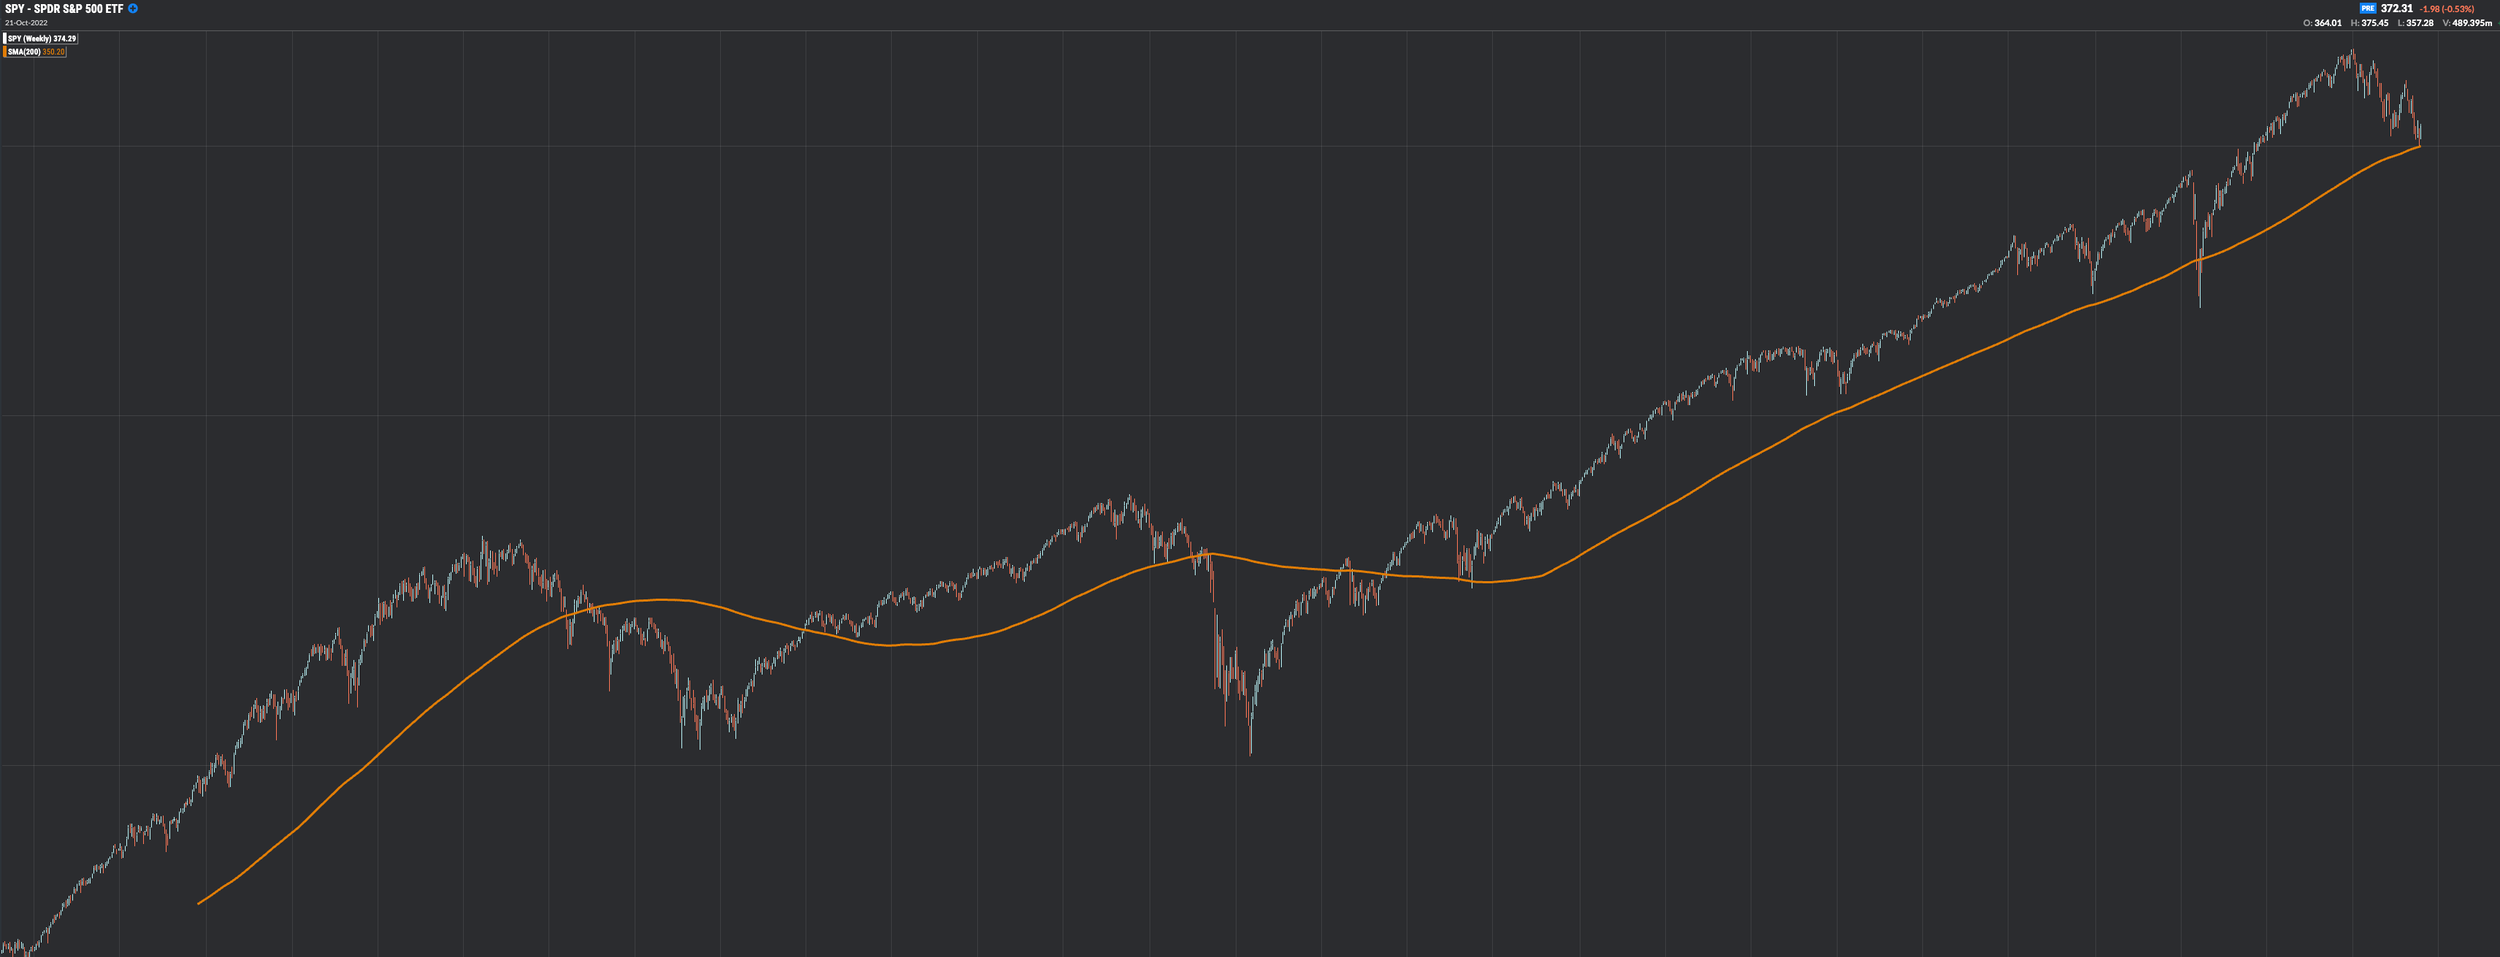
The 200-week moving average acting as a long-short signal provides a crude, but effective trend following model. You can easily spot breaks above and below the average, that generally align with confirmed bear and bull market cycles.
The rally on Friday came on rumors from the “Fed Whisperer,” Nick Timaros of the WSJ, who suggested that the Fed is considering slowing the pace of rate hikes in December. This is the usual “Fed pivot” talk that we have become accustomed to during past “bear market rallies”. However, in order to confirm that such a rally is underway, we also need a positive reaction to earnings reports this week, which we might just get (since estimates have been lowered enough).
October is also a month that traditionally marks the bottom of equity markets. The lows have also occurred regularly before a midterm election, such as in 2022. Deutsche Bank notes:
“The S&P 500 has risen in the year after every single one of the 19 midterm elections since World War II, with not a single instance seeing a negative return.”
However, as noted in our past newsletter, many factors that precede bear market bottoms are currently missing. BofA recently published a checklist of “signposts” that previously signaled bear market lows. Currently, only 2 of the 10-signposts are registered.
Our thinking is that even if the current rally in the equities catches some momentum, it will still ultimately fail. The final leg lower might occur in 2023, as a recession finally sets in.
For the moment, earnings have been good enough to support prices. Our Market Fundamentals Instrument updates on a weekly basis and aggregates S&P 500 companies financials into a couple of key charts. It is useful to gauge where we currently are in the earnings cycle. As shown below, Net Margins, EPS and Revenue Growth are merely struggling, but we could still make the argument they are at the high end of the current cycle.
Market Fundamentals
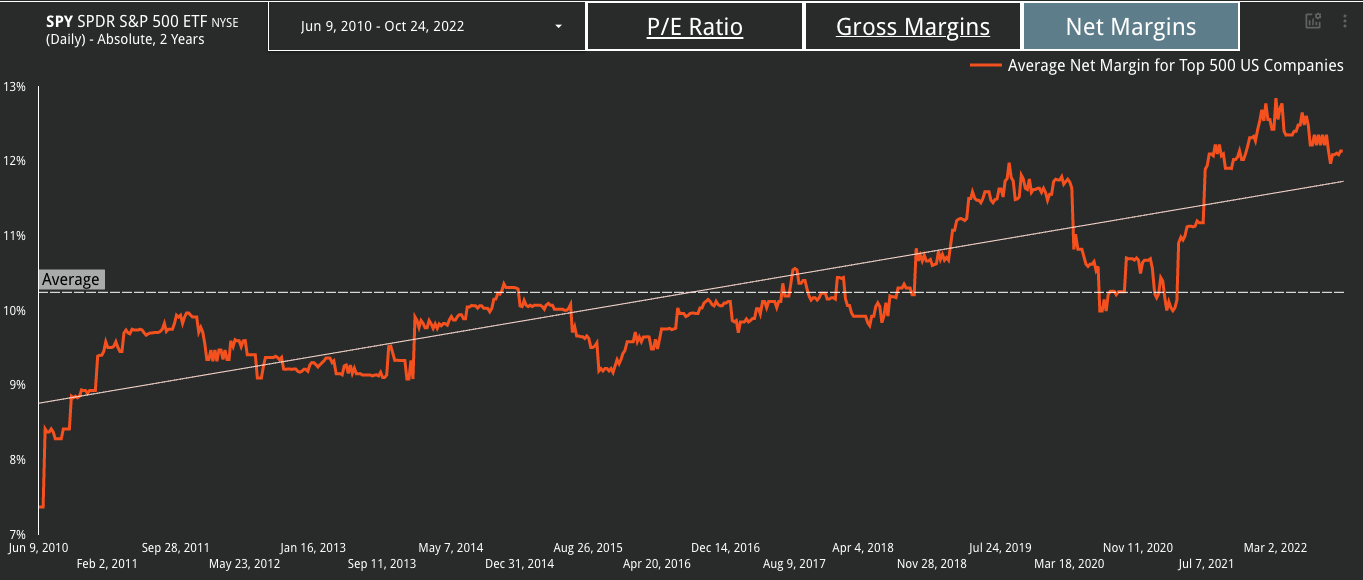


The Fed funds rate takes between 9 and 12 months to impact the economy in a meaningful way. What we are registering today are the effects of monetary policy that was set in the October - December 2021 period, back when inflation was still considered “transitory”. Using this logic, the July and August 2022 back to back rate hikes (the most aggressive up till now) will start showing up in Q1 - Q2 of 2023. That is the period that carries the highest risk to the “real economy”, and ultimately the “financial economy” that is supposed to mirror it through public securities.
Where do the opportunities lie?
Probably the most oversold asset class right now are treasuries, especially long dated ones. We use the TLT ETF as a proxy for long term government bonds, and currently nobody wants anything to do with them.


It is shocking to see an asset class of this size trade with a 42.5% drawdown in the past 2 years. While the technical damage will take some time to fix, the bear market in bonds might be closer to the end rather than not. During a recession, the most common flows are safety trades from stocks to treasuries, so we are actively watching TLT for a trade-able entry point.
Furthermore, we can use the Stock Screener Instrument to find the stocks which are holding up the best during this period. Using a couple of predictive performance factors will enable us to generate portfolio ideas and serve as the starting point for further research.
Z-Relative > 0 (returns stocks outperforming their benchmarks)
Sharpe Ratio > 0 (returns stocks generating positive risk-adjusted returns)
Piotroski F-Score => 6 (returns stocks with strong fundamentals)
We have highly competitive list so far that can be further enhanced according to your particular requirements. In our case, we will select low volatility and high Operating Leverage, a potent combination of factors in the current environment:
Operating Leverage > 1 (returns stocks with a wide moat and effective business model)
Beta to SPY > 0.5 and < 0.9, used as sort criteria, lowest first (returns lower volatility instruments)
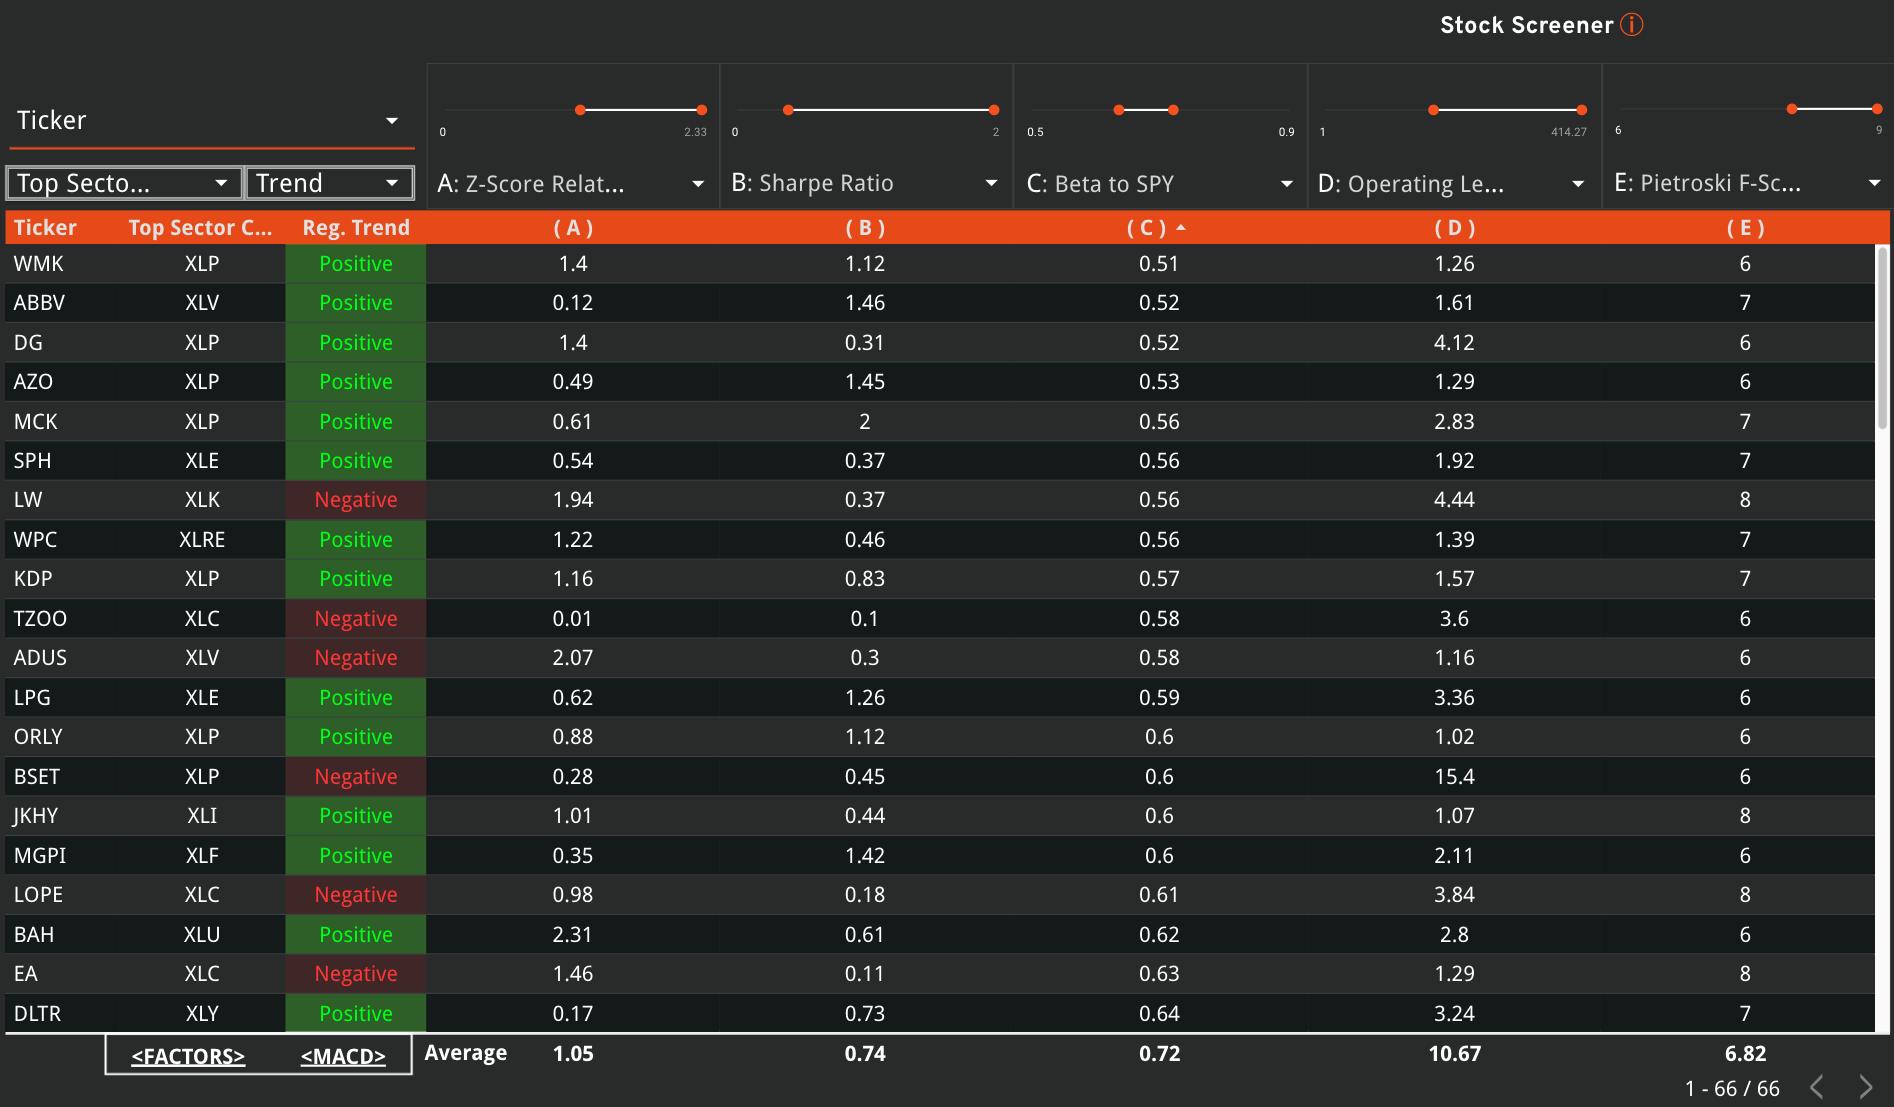
Standout sectors from the list include Industrials and Consumer Staples, both sectors that are outperforming the broad market.
Speaking of which, let’s go over some key levels for SPY.
SPY Analysis

According to our methodology, there are no immediate levels of support for the market that we can bet on. Equities are not an investible asset class for the moment,
Other trend following models are building long positions above SPY 360, and we can (manually) decide to speculate on a short term rally from here. The target for the rally is the 50-day MA, at 387, with even more upside possible until 394 (the lower channel trendline).
With 99 companies in the S&P 500 that have reported quarterly earnings as of Friday, 74.7% beat analysts' expectations, according to Refinitiv data. This beat-rate suggests heavily sandbagged expectations, with the bar lowered so that estimates could be surpassed comfortably.
Focus now shifts to reports this week from big tech and growth companies. Alphabet Inc (GOOGL.O) will report on Tuesday, followed by Facebook-parent Meta Platforms Inc (META.O) on Wednesday and Apple Inc (AAPL.O) and Amazon.com Inc (AMZN.O) on Thursday. Given the low-expectations set by analysts, I expect this week’s earnings to provide a boost to the overall market.
Takeaway
Short term, the risk-reward equation continues to favor the bulls. Using the 360 level on SPY as the pivot point for equity exposure makes sense, as various trend-following models are doing the same.
The plan in the medium term is to get the Sigma Portfolio to a fully market-neutral allocation. If the market will trade to short-term overbought conditions, we will use that to flip our portfolio net short and speculate on further downside. For now, we are slightly long equities, with a couple of additional ETF trading positions in our PA’s, not reflected in the official Sigma Portfolio positioning due to their speculative nature.
Andrei Sota