Analyze a Security
Evaluate a Stock
A Step-by-Step guide to our proprietary method of Fundamental + Technical Analysis for a single non-financial Stock
Scope
By the end of this activity, you will have a thorough understanding of the present day risk-reward proposition of any non-financial stock.
Duration
20-45 minutes depending on your level of proficiency and the detail of your research; taking more time for this activity will not materially increase the accuracy of your conclusions.
Prerequisites
You need to have selected a non-financial stock to do research on; banks, insurance companies or funds are not compatible with our model due to their different balance sheet reporting.
Deliverables
At the end of this activity you will get:
A Price Target for the Stock
An estimated EPS Growth Rate
A good understanding of risks and opportunities associated with the Stock and its industry / sector
A good understanding of the present day risk-reward setup for the underlying security
A > Get an Overview
The first order of business when researching any stock is to familiarize yourself with the industry that the company is operating in. This will help us set baseline expectations regarding key metrics in an operating model. We can also study the main competitors for a company in order to gain an insight into the playing field.
For this example, we will analyze Home Depot (HD) - the largest home improvement retailer in the US.
Use the Peer Finder to scan for competition
Click Here to open the Peer Finder & Combined Chart
Input the ticker into the PEER GROUP selection field. We have pre-selected HD (Home Depot) for this walkthrough
You will get an output similar to this:

Note that Accenture PLC (ACN) - an IT company - is included in the Peers List. Accenture is not a home improvement retailer, so why does our Peer Finder list it as a potential competitor? Hint: it’s because some key business metrics align!
Accenture has an almost identical Operating Margin to Home Depot (15.3%) and a very similar Profit Margin (11.3% vs 10.7%). This allows us to study similar companies across various sectors and industries, and compare multiples. But we are not there yet. For the moment, we’d just like to view actual competitors to Home Depot. We need to restrict the Peer Finder to a relevant Sector and Industry.
Limit the Peer Finder to 5 companies at most (recommended)
3. Use the Sector and Industry selection boxes to include only the relevant industries
4. Look at other metrics and leave out only companies that broadly match in terms of business model (similar Operating and Profit Margin)
In this case, we notice that LL (LL Floor Holdings) is an outlier in terms of both Operating and Profit Margin, so we manually remove it using the Symbol drop-down menu. We get the updated Peers List

Great! Now we have a shortlist of comparable companies, and it’s time to get a broad understanding of their key metrics. The Peer Finder displays a host of technical and fundamental measures below the main table, that we can browse. We are usually focused on fundamentals.
Review key industry metrics
5. Take a note of the following in order to determine how your company compares to the competition:
- Sales Growth
- Operating Margin
- Profit Margin
- Valuation
6. Scroll below the table all the way down and note the 3 balance sheet ratios:
- Quick Ratio (measures liquidity)
- Debt-to-Equity Ratio (measures financial leverage)
- Return on Equity (measures management efficiency)
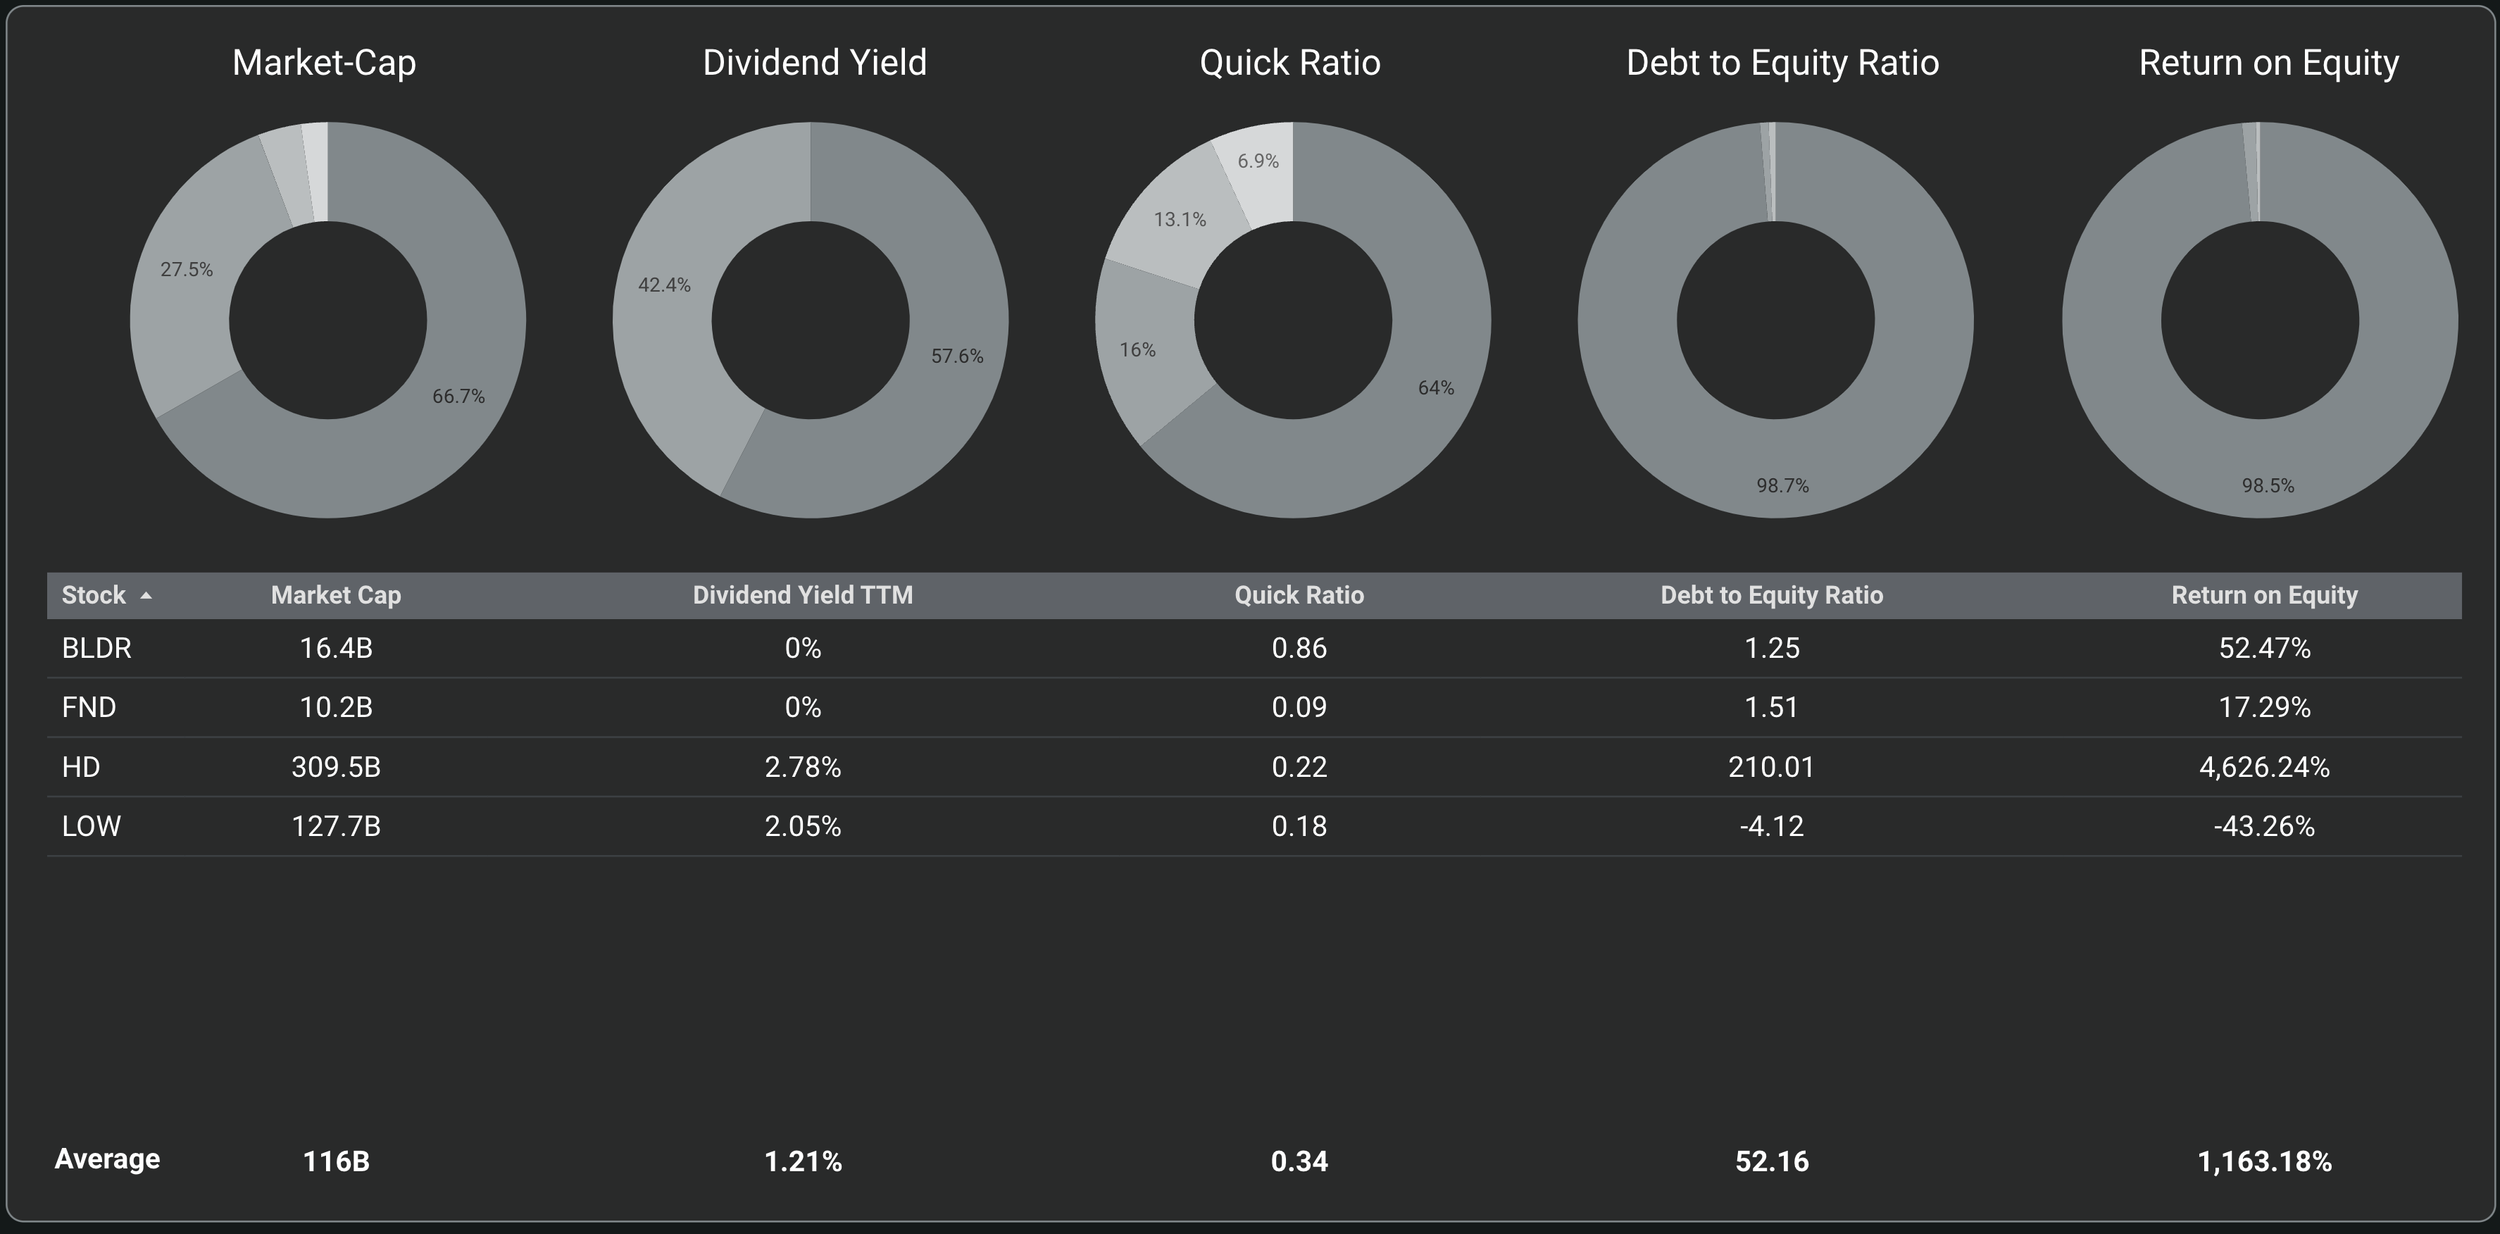
Chart the Stock versus the Peer Group
7. In the Comparison Tickers selection box, input the stock you are analyzing (HD in our example)
8. Click the button labeled “Display Group on Chart & Compare” to see how the price performance of the analyzed stock compares to its peer group


Browse the Income Statement and the Balance Sheet
9. Click here to launch the Yearly Fundamentals Explorer
10. Input the analyzed companies in the selection box, and establish key industry trends - we will use them as a baseline in the next step
Example Industry Analysis
Following the process above, we get the key values that will form the basis of our Fundamental Assumptions in the next step:
Industry Average Gross Profit Margin: 34%
Industry Gross Profit Margin Trend: NEUTRAL
Industry Average Operating Expenses % of Sales: 24%
Industry Average Sales Growth: 12.74%

Hint: hovering the mouse over a metric in the waterfall chart will give you the average percentage values, as well as nominal values
B > Create a Financial Model for the Company
We shall input our assumptions about the future into the Valuation Wizard Instrument. For this step, it’s useful to have the company’s latest investor presentation on hand in order to check management guidance. We’ll also keep several instruments open side by side.
Use the Valuation Wizard to reach a Price Target and EPS Growth Rate
Click Here to open the Valuation Wizard Instrument
Click Here to open the Quarterly Fundamentals Explorer
Input the ticker into the selection box for each instrument, click NEXT in the Valuation Wizard to start the process

Model Revenue Growth
The first step in the Valuation Wizard is modelling revenue growth using a constant value for the following 5 years. We already know 2 baseline values:
The Industry Average Sales Growth: 12.74% (calculated earlier)
The 2-year Revenue Growth Average: 9.27% (shown in the Valuation Wizard)
Check the Quarterly Fundamentals to see if these growth trends are sustainable and realistic. Don’t forget to review the company’s own guidance for clues on Revenue Growth. Adjust the baseline assumptions to account for each of these factors.
4. Input the Revenue Growth Rate and click NEXT

A red flag surfaces in the Quarterly Income Statement, as Revenue Growth dropped from 30% toward 0% in the last 2 years; for the latest year, growth has not exceeded the 2-year growth average in any of the 4 quarters.
In our example model, we will set Revenue Growth at 6% in the Valuation Wizard, which accounts for the recent slowdown, and HD’s sales size. Even if this is a conservative assumption, it will allow us a margin of safety, which is always the better way to do a model.
Model Gross Profit Margin
The second step in the Valuation Wizard is modelling the Gross Profit Margin. We already know 2 baseline values:
The Industry Average Gross Profit Margin: 34%, with a NEUTRAL trend (calculated earlier)
The 2-year Gross Profit Margin: 33.58% (shown in the Valuation Wizard)
5. Input the Gross Margin assumption and click NEXT
In our example model, we will set Gross Profit Margin at 34%, which seems adequate, given the company’s own history and the industry average.
Model Operating Expenses
The third step in the Valuation Wizard is modelling the Operating Expenses as a percent of Sales. We already know 2 baseline values:
The Industry Average Operating Expenses as a percent of Sales: 24% (calculated earlier)
The 2-year Operating Expenses as a percent of Sales: 18.32% (shown in the Valuation Wizard)
6. Input the Operating Expenses assumption and click NEXT
In our example model, we will set Operating Expenses as a percent of Sales at 20%, which seems adequate, given the company’s own history and the industry average.
Model Shares Outstanding
The fourth step in the Valuation Wizard accounts for a share buyback programme or share count dilution.
If the company has an active share buyback program, the number should be negative (declining share count)
If the company has a track record of diluting shareholders, the assumption should be a positive value (growing share count)
7. Input the Share Growth assumption and click NEXT
In our example model, we will leave Shares Growth at 0%, assuming no change in shares outstanding.
Assign an EV / EBITDA multiple, input WACC and Tax Rate
The fifth and final step in the Valuation Wizard requires the input of an EV / EBITDA multiple, Weighted Average Cost of Capital and Tax Rate
The average EV / EBITDA multiple is displayed in the Valuation Wizard
A chart showing the evolution of EV / EBITDA is shown in the Technical Analysis Instrument, below the main chart - this can be used to model a company using its own valuation history
The Peer Finder can also be used to find an average industry multiple, or a multiple for a specific competitor
The Weighted Average Cost of Capital can be found online, free of charge
The Tax Rate changes infrequently and the current value should be used
8. Input the variables and click NEXT
In our example model, we will input an EV / EBITDA multiple of 14, a WACC of 8.7% and leave the Tax Rate at 21%. See the Model Output below:

We get a $359.50 Price Target and an EPS Growth Rate between 5.37% and 6.34%. Let’s put these results in the context of a price chart.
C > Adjust the Technical Chart
By default, a price chart with overlaid technical indicators represents what we like to call “just lines on a chart”. How do you go from “just lines on a chart” to “fundamentally accurate technical analysis”? Read on below.
Start by using pure Technical Analysis
Click Here to open the Technical Analysis Instrument
Input the stock’s ticker into the selection box in the top-left of the chart
The default view is an unadjusted version of pure technical analysis, with the trading channel derived from the stock’s 2-year history
Our example model for HD looks like this at the time of writing this guide (04.04.2023)

Adjust the chart by inputting the Results you got form the Fundamental Model

3. Input the Fundamental Price Target in the first box
4. Input the EPS Growth Rate (equivalent to Compound Annual Growth Rate) in the second box
When both the Price Target and CAGR have non-zero values, the chart will adjust to account for both variables.
For our example, we adjusted the chart using a $360 Price Target (rounded up from 359.50) and a 5.8% CAGR (mean value between short and long term EPS Growth).
We can now see how our fundamental assumptions look like.


The stock is currently trading significantly below our adjusted technical channel. This may flag an error in our judgement. Or it may mean we can buy the stock at a very good price. We might be wrong in our fundamental assumptions, or the market may be wrong in its pricing. How can we double check our work?
Compare your Price Target with other analysts
The Technical Analysis Instrument conveniently displays a Mean Price Target sourced from various analysts in the bottom-right corner. However, it is often useful to compare your Price Target with that of a single other analyst and understand his/her reasoning.
If you have access to a platform that aggregates analyst Price Targets, now’s the time to use it.
For our example, HD’s $360 Price Target is confirmed by 3 analysts, according to TipRanks: Peter Benedict from Robert W. Baird, Simeon Gutman from Morgan Stanley and Max Rakhlenko from Cowen & Co. If your chart looks “way off”, it simply means the market is not in agreement with the analysts. Sometimes this marks an opportunity, other times it represents a valid warning.
Think about the technicals and the fundamentals as a dialogue between two equally important parties. Harmonizing both is part art, part science.

Adjust your Fundamental Model (Optional)
You may want to return to the Valuation Wizard and make adjustments to your model, after seeing the first results on a chart. Sometimes, a simple variable change will put the technicals in alignment with the fundamentals. Feel free to experiment! You now have all the tools and the knowledge.
In our example, simply adjusting the EV / EBITDA multiple from 14 to 12.5 results in a lowering of the Price Target from $360 to $325, which is much more in agreement with the technical side. It is also aligned with the Mean Analyst Price Target of $327. See the implication below when re-adjusting the chart:

A word on management guidance and best practices
In any given choice when building the model, always err on the side of safety. Make conservative assumptions. Try to think as rationally as possible and avoid subjective opinions. Usually, hard facts and raw numbers tell the story better than any CEO or CFO. For building the example model in this guide, we did not consult any marketing material from the company itself. We did not listen in on an earnings call. We did not consult any investor presentation. We just used the publicly available financial reports and our own tools.
However, when dealing with small and niche companies, operating in niche markets, this approach is no longer as valid. Home Depot is a large and predictable corporation, operating in a large and predictable market.
Compare that with a micro-cap company that specialises in producing optical equipment adapted for AI analysis of cancer cells. Suddenly, you need to listen to management a lot more, in order to understand where that company is headed. The same financial modelling principles apply, but management guidance should weigh a lot more in your decision making.

A Step-by-Step guide to our proprietary method of Fundamental + Technical Analysis for a single non-financial Stock
Evaluate a Stock
Scope
By the end of this activity, you will have a thorough understanding of the present day risk-reward proposition of any non-financial stock.
Duration
20-45 minutes depending on your level of proficiency and the detail of your research; taking more time for this activity will not materially increase the accuracy of your conclusions.
Prerequisites
You need to have selected a non-financial stock to do research on; banks, insurance companies or funds are not compatible with our model due to their different balance sheet reporting.
A desktop, laptop or tablet device to access the platform on
Deliverables
At the end of this activity you will get:
A Price Target for the Stock
An estimated EPS Growth Rate
A good understanding of risks and opportunities associated with the Stock and its industry / sector
A good understanding of the present day risk-reward setup for the underlying security
The first order of business when researching any stock is to familiarize yourself with the industry that the company is operating in. This will help us set baseline expectations regarding key metrics in an operating model. We can also study the main competitors for a company in order to gain an insight into the playing field.
For this example, we will analyze Home Depot (HD) - the largest home improvement retailer in the US.
Get an Overview
Use the Peer Finder to scan for competition
Click Here to open the Peer Finder
Input the ticker into the selection field
You will get an output similar to this:
Note that Accenture PLC (ACN) - an IT company - is included in the Peers List. Accenture is not a home improvement retailer, so why does our Peer Finder list it as a potential competitor? Hint: it’s because some key business metrics align!
Accenture has an identical Operating Margin to Home Depot (15.3%) and a very similar Profit Margin (11% vs 10.9%). This allows us to study similar companies across various sectors and industries, and compare multiples. But we are not there yet. For the moment, we’d just like to view actual competitors to Home Depot. We need to restrict the Peer Finder to a relevant Sector and Industry.
Limit the Peer Finder to 5 companies at most
3. Use the Sector and Industry selection boxes to include only the relevant industries
4. Look at other metrics and leave out only companies that broadly match in terms of business model (similar Operating and Profit Margin)
In this case, we notice that LL (LL Floor Holdings) is an outlier in terms of both Operating and Profit Margin, so we manually remove it using the Symbol drop-down menu. We get the updated Peers List

Review the Yearly Financials and note key industry metrics
5. Click Here to open the Yearly Fundamentals Explorer
6. Input the relevant companies from the Peer Finder into the selection box. Take a note of the following:
- Average Gross Profit Margin for all years + trend of latest year vs average
- Average Operating Expenses % of Sales for all years
- Average Revenue Growth for the last year (you will find this in the Peer Finder at the bottom of the Sales Growth column)
Great! Now we have a shortlist of companies, and it’s time to get a broad understanding of their key financial metrics. This list needs to be compact in order to make the next step more efficient. We don’t recommend using more than 5 peers for this analysis.
Example Industry Analysis
Following the process above, we get the key values that will form the basis of our Fundamental Assumptions in the next step:
Industry Average Gross Profit Margin: 34%
Industry Gross Profit Margin Trend: NEUTRAL
Industry Average Operating Expenses % of Sales: 24%
Industry Average Sales Growth: 12.74%
Hint: hovering the mouse over a metric in the waterfall chart will give you the average percentage values, as well as nominal values
Create a Financial Model for the Company
We shall input our assumptions about the future into the Valuation Wizard Instrument. For this step, it’s useful to have the company’s latest investor presentation on hand in order to check management guidance. We’ll also keep several instruments open side by side.
Use the Valuation Wizard to reach a Price Target and EPS Growth Rate
Open the Valuation Wizard Instrument
Open the Quarterly Fundamentals Explorer
Input the ticker into the selection box for each instrument, click NEXT in the Valuation Wizard to start the process
Model Revenue Growth
The first step in the Valuation Wizard is modelling revenue growth using a constant value for the following 5 years. We already know 2 baseline values:
The Industry Average Sales Growth: 12.74% (calculated earlier)
The 2-year Revenue Growth Average: 9.27% (shown in the Valuation Wizard)
Check the Quarterly Fundamentals to see if these growth trends are sustainable and realistic. Don’t forget to review the company’s own guidance for clues on Revenue Growth. Adjust the baseline assumptions to account for each of these factors.
4. Input the Revenue Growth Rate and click NEXT
A red flag surfaces in the Quarterly Income Statement, as Revenue Growth dropped from 30% toward 0% in the last 2 years; for the latest year, growth has not exceeded the 2-year growth average in any of the 4 quarters.
In our example model, we will set Revenue Growth at 6% in the Valuation Wizard, which accounts for the recent slowdown, and HD’s sales size. Even if this is a conservative assumption, it will allow us a margin of safety, which is always the better way to do a model.
Model Gross Profit Margin
The second step in the Valuation Wizard is modelling the Gross Profit Margin. We already know 2 baseline values:
The Industry Average Gross Profit Margin: 34%, with a NEUTRAL trend (calculated earlier)
The 2-year Gross Profit Margin: 33.58% (shown in the Valuation Wizard)
5. Input the Gross Margin assumption and click NEXT
In our example model, we will set Gross Profit Margin at 34%, which seems adequate, given the company’s own history and the industry average.
Model Operating Expenses
The third step in the Valuation Wizard is modelling the Operating Expenses as a percent of Sales. We already know 2 baseline values:
The Industry Average Operating Expenses as a percent of Sales: 24% (calculated earlier)
The 2-year Operating Expenses as a percent of Sales: 18.32% (shown in the Valuation Wizard)
6. Input the Operating Expenses assumption and click NEXT
In our example model, we will set Operating Expenses as a percent of Sales at 20%, which seems adequate, given the company’s own history and the industry average.
Model Shares Outstanding
The fourth step in the Valuation Wizard accounts for a share buyback programme or share count dilution.
If the company has an active share buyback program, the number should be negative (declining share count)
If the company has a track record of diluting shareholders, the assumption should be a positive value (growing share count)
7. Input the Share Growth assumption and click NEXT
In our example model, we will leave Shares Growth at 0%, assuming no change in shares outstanding.
Assign an EV / EBITDA multiple, input WACC and Tax Rate
The fifth and final step in the Valuation Wizard requires the input of an EV / EBITDA multiple, Weighted Average Cost of Capital and Tax Rate
The average EV / EBITDA multiple is displayed in the Valuation Wizard
A chart showing the evolution of EV / EBITDA is shown in the Technical Analysis Instrument, below the main chart - this can be used to model a company using its own valuation history
The Peer Finder can also be used to find an average industry multiple, or a multiple for a specific competitor
The Weighted Average Cost of Capital can be found online, free of charge
The Tax Rate changes infrequently and the current value should be used
8. Input the variables and click NEXT
In our example model, we will input an EV / EBITDA multiple of 14, a WACC of 8.7% and leave the Tax Rate at 21%. See the Model Output below:
We get a $359.50 Price Target and an EPS Growth Rate between 5.37% and 6.34%. Let’s put these results in the context of a price chart.
By default, a price chart with overlaid technical indicators represents what we like to call “just lines on a chart”. How do you go from “just lines on a chart” to “fundamentally accurate technical analysis”? Read on below.
Adjust the Technical Chart
Start by using pure Technical Analysis
Open the Technical Analysis Instrument
Input the stock’s ticker into the selection box in the top-left of the chart
The default view is an unadjusted version of pure technical analysis, with the trading channel derived from the stock’s 2-year history
Our example model for HD looks like this at the time of writing this guide (04.04.2023)
Adjust the chart by inputting the Results you got form the Fundamental Model
3. Input the Fundamental Price Target in the first box
4. Input the EPS Growth Rate (equivalent to Compound Annual Growth Rate) in the second box
When both the Price Target and CAGR have non-zero values, the chart will adjust to account for both variables.
For our example, we adjusted the chart using a $360 Price Target (rounded up from 359.50) and a 5.8% CAGR (mean value between short and long term EPS Growth).
We can now see how our fundamental assumptions look like.
The stock is currently trading significantly below our adjusted technical channel. This may flag an error in our judgement. Or it may mean we can buy the stock at a very good price. We might be wrong in our fundamental assumptions, or the market may be wrong in its pricing. How can we double check our work?
Compare your Price Target with other analysts
The Technical Analysis Instrument conveniently displays a Mean Price Target sourced from various analysts in the bottom-right corner. However, it is often useful to compare your Price Target with that of a single other analyst and understand his/her reasoning.
If you have access to a platform that aggregates analyst Price Targets, now’s the time to use it.
For our example, HD’s $360 Price Target is confirmed by 3 analysts, according to TipRanks: Peter Benedict from Robert W. Baird, Simeon Gutman from Morgan Stanley and Max Rakhlenko from Cowen & Co. If your chart looks “way off”, it simply means the market is not in agreement with the analysts. Sometimes this marks an opportunity, other times it represents a valid warning.
Think about the technicals and the fundamentals as a dialogue between two equally important parties. Harmonizing both is part art, part science.
Adjust your Fundamental Model (Optional)
You may want to return to the Valuation Wizard and make adjustments to your model, after seeing the first results on a chart. Sometimes, a simple variable change will put the technicals in alignment with the fundamentals. Feel free to experiment! You now have all the tools and the knowledge.
In our example, simply adjusting the EV / EBITDA multiple from 14 to 12.5 results in a lowering of the Price Target from $360 to $325, which is much more in agreement with the technical side. It is also aligned with the Mean Analyst Price Target of $327. See the implication below when re-adjusting the chart:
A word on management guidance and best practices
In any given choice when building the model, always err on the side of safety. Make conservative assumptions. Try to think as rationally as possible and avoid subjective opinions. Usually, hard facts and raw numbers tell the story better than any CEO or CFO. For building the example model in this guide, we did not consult any marketing material from the company itself. We did not listen in on an earnings call. We did not consult any investor presentation. We just used the publicly available financial reports and our own tools.
However, when dealing with small and niche companies, operating in niche markets, this approach is no longer as valid. Home Depot is a large and predictable corporation, operating in a large and predictable market.
Compare that with a micro-cap company that specialises in producing optical equipment adapted for AI analysis of cancer cells. Suddenly, you need to listen to management a lot more, in order to understand where that company is headed. The same financial modelling principles apply, but management guidance should weigh a lot more in your decision making.