Ark Fintech Innovation ETF (ARKF) Report
This report has been requested by Jonathan, one of our members.
Since we are covering an ETF, we will take a slightly different approach in the valuation process, and focus on the top holdings. Summing up, we will look at the technicals of the ETF itself and set a rating and a price target for the instrument.
What is ARKF?
“ARKF is an actively managed Exchange Traded Fund (ETF) that seeks long-term growth of capital. It seeks to achieve this investment objective by investing under normal circumstances primarily (at least 80% of its assets) in domestic and foreign equity securities of companies that are engaged in the Fund’s investment theme of financial technology (“Fintech”) innovation.” - so this is a rather broad description from the company’s website.
Which companies does the fund seek to invest in?
“A company is deemed to be engaged in the theme of Fintech innovation if it derives a significant portion of its revenue or market value from the theme of Fintech innovation, or it has stated its primary business to be in products and services focused on the theme of Fintech innovation. The Adviser defines “Fintech innovation” as the introduction of a technologically enabled new product or service that potentially changes the way the financial sector works, which ARK believes includes but is not limited to the following business platforms:
Transaction Innovations
Blockchain Technology
Risk Transformation
Frictionless Funding Platforms
Customer Facing Platforms
New Intermediaries
The fund has $817.2 Million in Net Assets, holds 35-55 open positions with a $25 Billion Average Market Cap and is actively managed by ARK Investment Management LLC.
Largest Holdings
SHOP - 12.05%
SQ - 10.17%
COIN - 6.35%
MELI - 6.05%
TWLO - 5.33%
HOOD - 5.28%
PATH - 5.15%
DKNG - 5.08%
DSY - 5.05%
ADYEN - 4.76%
Time to place these positions (the US incorporated ones at least) on our stock screener to derive some average stats.
Correlation Screener
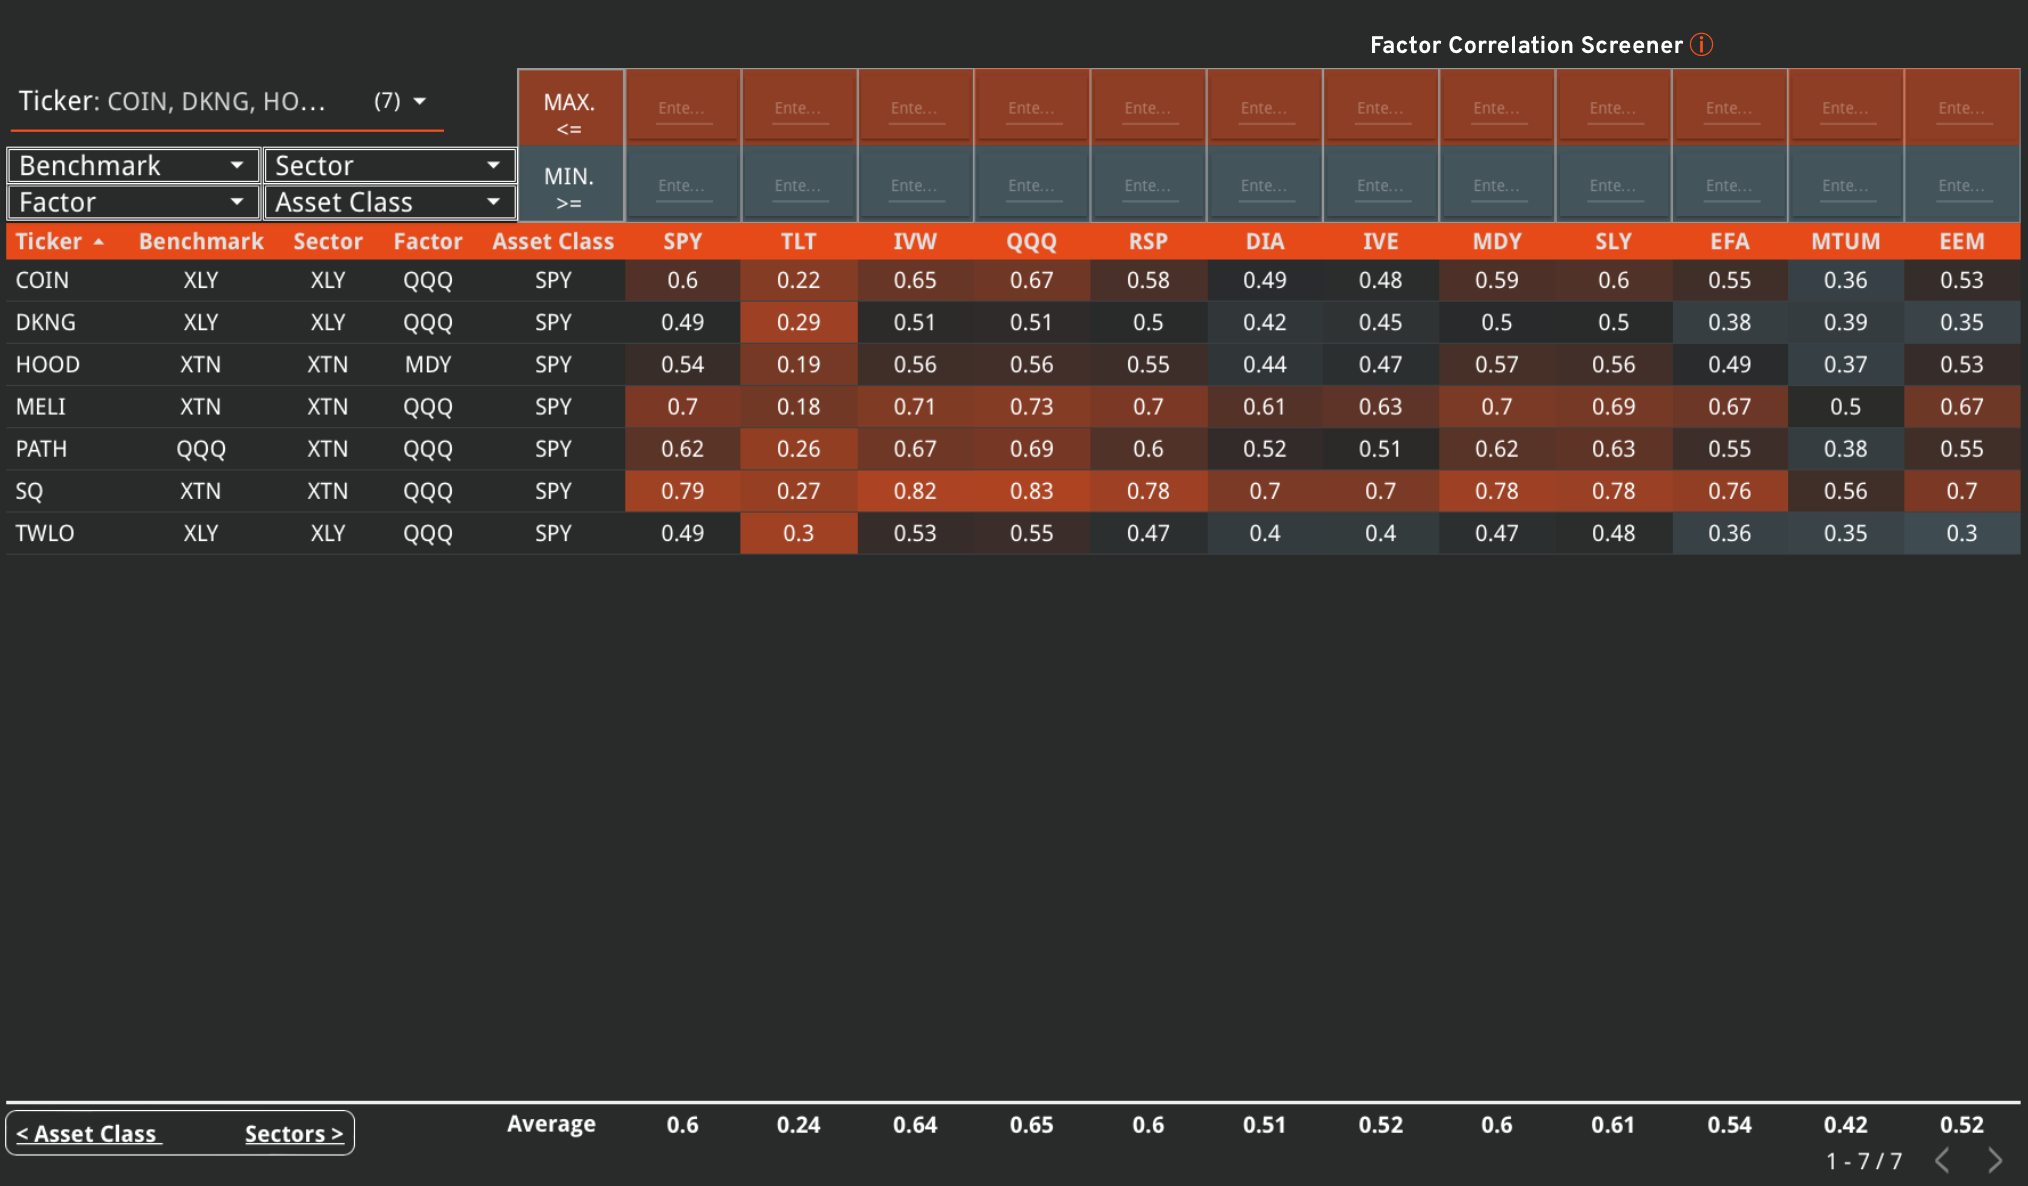
The first thing that jumps to my attention from the Factor Correlation Screener is the unusually high score for TLT (as denoted by the orange “hot” color). This group of assets must be highly dependent on the movement of long term interest rates.
Which of course makes sense, since their valuation is derived from the discount rate applied to their future cashflows. Similarly, they are correlated with QQQ (Tech), and IWV (Growth). We are dealing with a group of stocks that have done very badly this year, since value and profitable companies have been hot. Stocks that promise investors future cashflows and are currently not profitable, have been heavily discounted.
Out of this group of companies, only MELI (Mercado Libre) and SQ (Block INC) are currently profitable. Let’s dig in to the other fundamental metrics for the group (using the Stock Screener).
30 Day Risk Free Trial
Try our Research Plan and see if it’s right for you.

Average Revenue Trends
For the companies that have 2 Year Average Revenue Growth data available, we can see that Revenue Growth is declining.
Manually going over the other companies financials reveals the same slowdown trend.

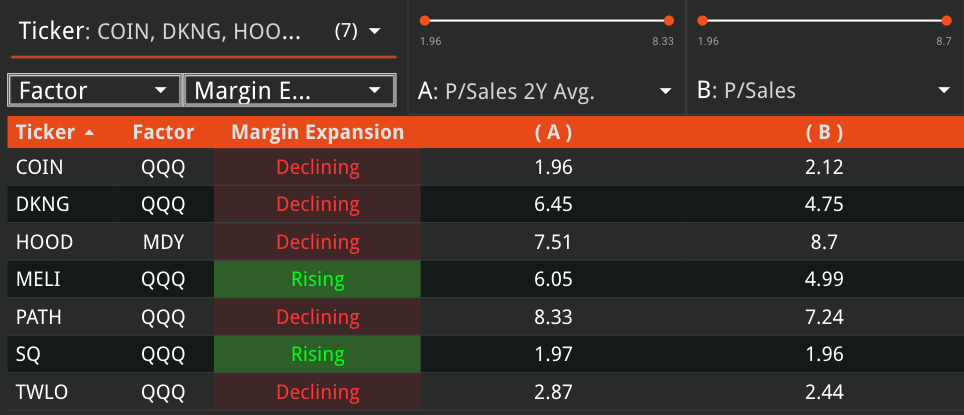
Average Growth Margin Trends
For most companies, the Gross Profit Margin is declining. As a group, however, the gross margin appears to keep flat.
MELI and SQ’s rising Gross Margin makes up for the other’s losses.

Operating Leverage
For the companies that have sufficient history, Operating Leverage is declining sharply. With the exception of MELI, which stands out as the only company that is actually expanding Operating Leverage.
Operating Leverage of 1 means that a 1% increase in revenues directly translates to a 1% increase in Earnings. Higher ratios are better.
Valuation
For most stocks in the group, valuation ha declined or kept flat.
COIN, and HOOD stand out as their valuation has actually increased.
DKNG and PATH seem undervalued versus this group.
Technicals
We plot the technical chart of the ARKF ETF with our Single Instrument Technical Analysis tool. For reference, we set a Price Target of 15 (-4.7% downside) and a flat-ish CAGR slope of 3%.

The expected outcome for the future path of this ETF is WIDE. In the best case, the upper technical band is above $23 (53% upside). In the worst case, this could go to $9 (-40% downside). The risk/reward seems balanced, but I am personally not sold on the prospects for this ETF. Let’s review the factors that come into the valuation:
Interest Rates (80% priced in, could have further downside)
Sales Growth (slowdown in 2023 50% priced in)
Gross Margin Decline (80% priced in)
I believe most factors are adequately priced in at this point. However, there is little room for error and this ETF (like the whole Tech industry) is prone to trading sideways and on sentiment for the time being.
Get market updates in your mailbox as soon as they become available. Sign Up to our Press Account and claim your FREE Stock Report.
Conclusion
There are better companies in this ETF than the group itself. MELI, SQ and DKNG stand out as worth investigating further and possible candidates for a BUY rating. HOOD and COIN could see further pain, as their business models suffer a transition.
We assign a Price Target of $15 for ARKF (fair value estimate). The ETF becomes good value at or below $10 (Value Target).
Due to the wide range of outcomes and questionable business models of companies that make up this ETF, the assigned rating is HOLD.
Andrei Sota
Disclosures / Disclaimers: This is not a solicitation to buy, sell, or otherwise transact any stock or its derivatives. Nor should it be construed as an endorsement of any particular investment or opinion of the stock’s current or future price. To be clear, I do not encourage or recommend for anyone to follow my lead on this or any other stocks, since I may enter, exit, or reverse a position at any time without notice, regardless of the facts or perceived implications of this article.
I am not a financial advisor. Nor am I providing any recommendations, price targets, or opinions about valuation regarding the companies discussed herein. Any disclosures regarding my holdings are true as of the time this article is written, but subject change without notice. I frequently trade my positions, often on an intraday basis. Thus, it is possible that I might be buying and/or selling the securities mentioned herein and/or its derivative at any time, regardless of (and possibly contrary to) the content of this article.
I undertake no responsibility to update my disclosures and they may therefore be inaccurate thereafter. Likewise, any opinions are as of the date of publication, and are subject to change without notice and may not be updated. I believe that the sources of information I use are accurate but there can be no assurance that they are. All investments carry the risk of loss and the securities mentioned herein may entail a high level of risk. Investors considering an investment should perform their own research and consult with a qualified investment professional.
I wrote this article myself, and it expresses my own opinions. I am receiving no compensation for it, nor do I have a business relationship with any company whose stock is mentioned in this article. The information in this article is for informational purposes only and should not be regarded as investment advice or as a recommendation regarding any particular security or course of action.
The primary purpose of this blog/forum is to attract new contacts with professional industry expertise to share research and receive feedback (confirmation / refutation) regarding my investment theses.