Market Internals Report / April 28 2022
This article explores the various statistics you can find in the Market Internals Instrument, and ways you can interpret the data in order to refine your portfolio positioning. You can access the Market Internals Instrument here.
Extremely oversold conditions are increasing in frequency

Let’s get one thing out of the way - presently, equities are extremely oversold, with bearish sentiment prevailing both at an index level and especially at an individual stock level.
The chart above overlays the SPY with two important market breath measures - in white, we plot the average Overbought / Oversold reading for the top 1000 stocks by dollar volume. The horizontal dotted lines represent 2 standard deviations for this measure and tell us when the indicator is sitting at extremes. At the bottom of the chart, in orange / gray, we plot a bar chart with the number of stocks sitting at extreme overbought / oversold levels. The two dotted lines represent a 2 standard deviation observation for each reading.
I have added yellow vertical lines to the chart each time the average score was below 2 standard deviations and the number of oversold stocks was above 2 standard deviations (similar to present values). These were times of extreme downside pressure in the markets. All of these instances have previously been excellent buy-the-dip opportunities.
So should you “buy the dip” right now?
The answer should be “yes”, with one major caveat - as long as you believe we are in a bull market. For now, note the increasing frequency of “extreme oversold events”. Out of a total 10 events (including the present episode), 9 occurred in the past year and 7 were recorded in the past 6 months. The price levels of SPY is broadly similar when these events occurred (416 - 450), but trending lower, suggesting at least a major consolidation process is in place. This takes us to the next major point.
No new highs recently

You can think about the purpose of a trading period in a binary way - has the price moved higher or lower than the previous period? If the period in question is long enough (eg. one month) it could be a source of concern if the price does not manage to move higher, at the index level.
SPY has not been able to make any new highs for 78 days. This is a record for at least the past two years (for context, the Covid crash took the SPY from peak to through to recovery in 60 days) and the majority of SPY corrections ended in the span of 80 days with the index making a new high. The exceptions are periods of recession and bear markets, with YEARS of no new highs. 2007-2009 was the last similar event. To say the very least, this environment is no longer “fun” for retail investors new to investing.
Moving average situation
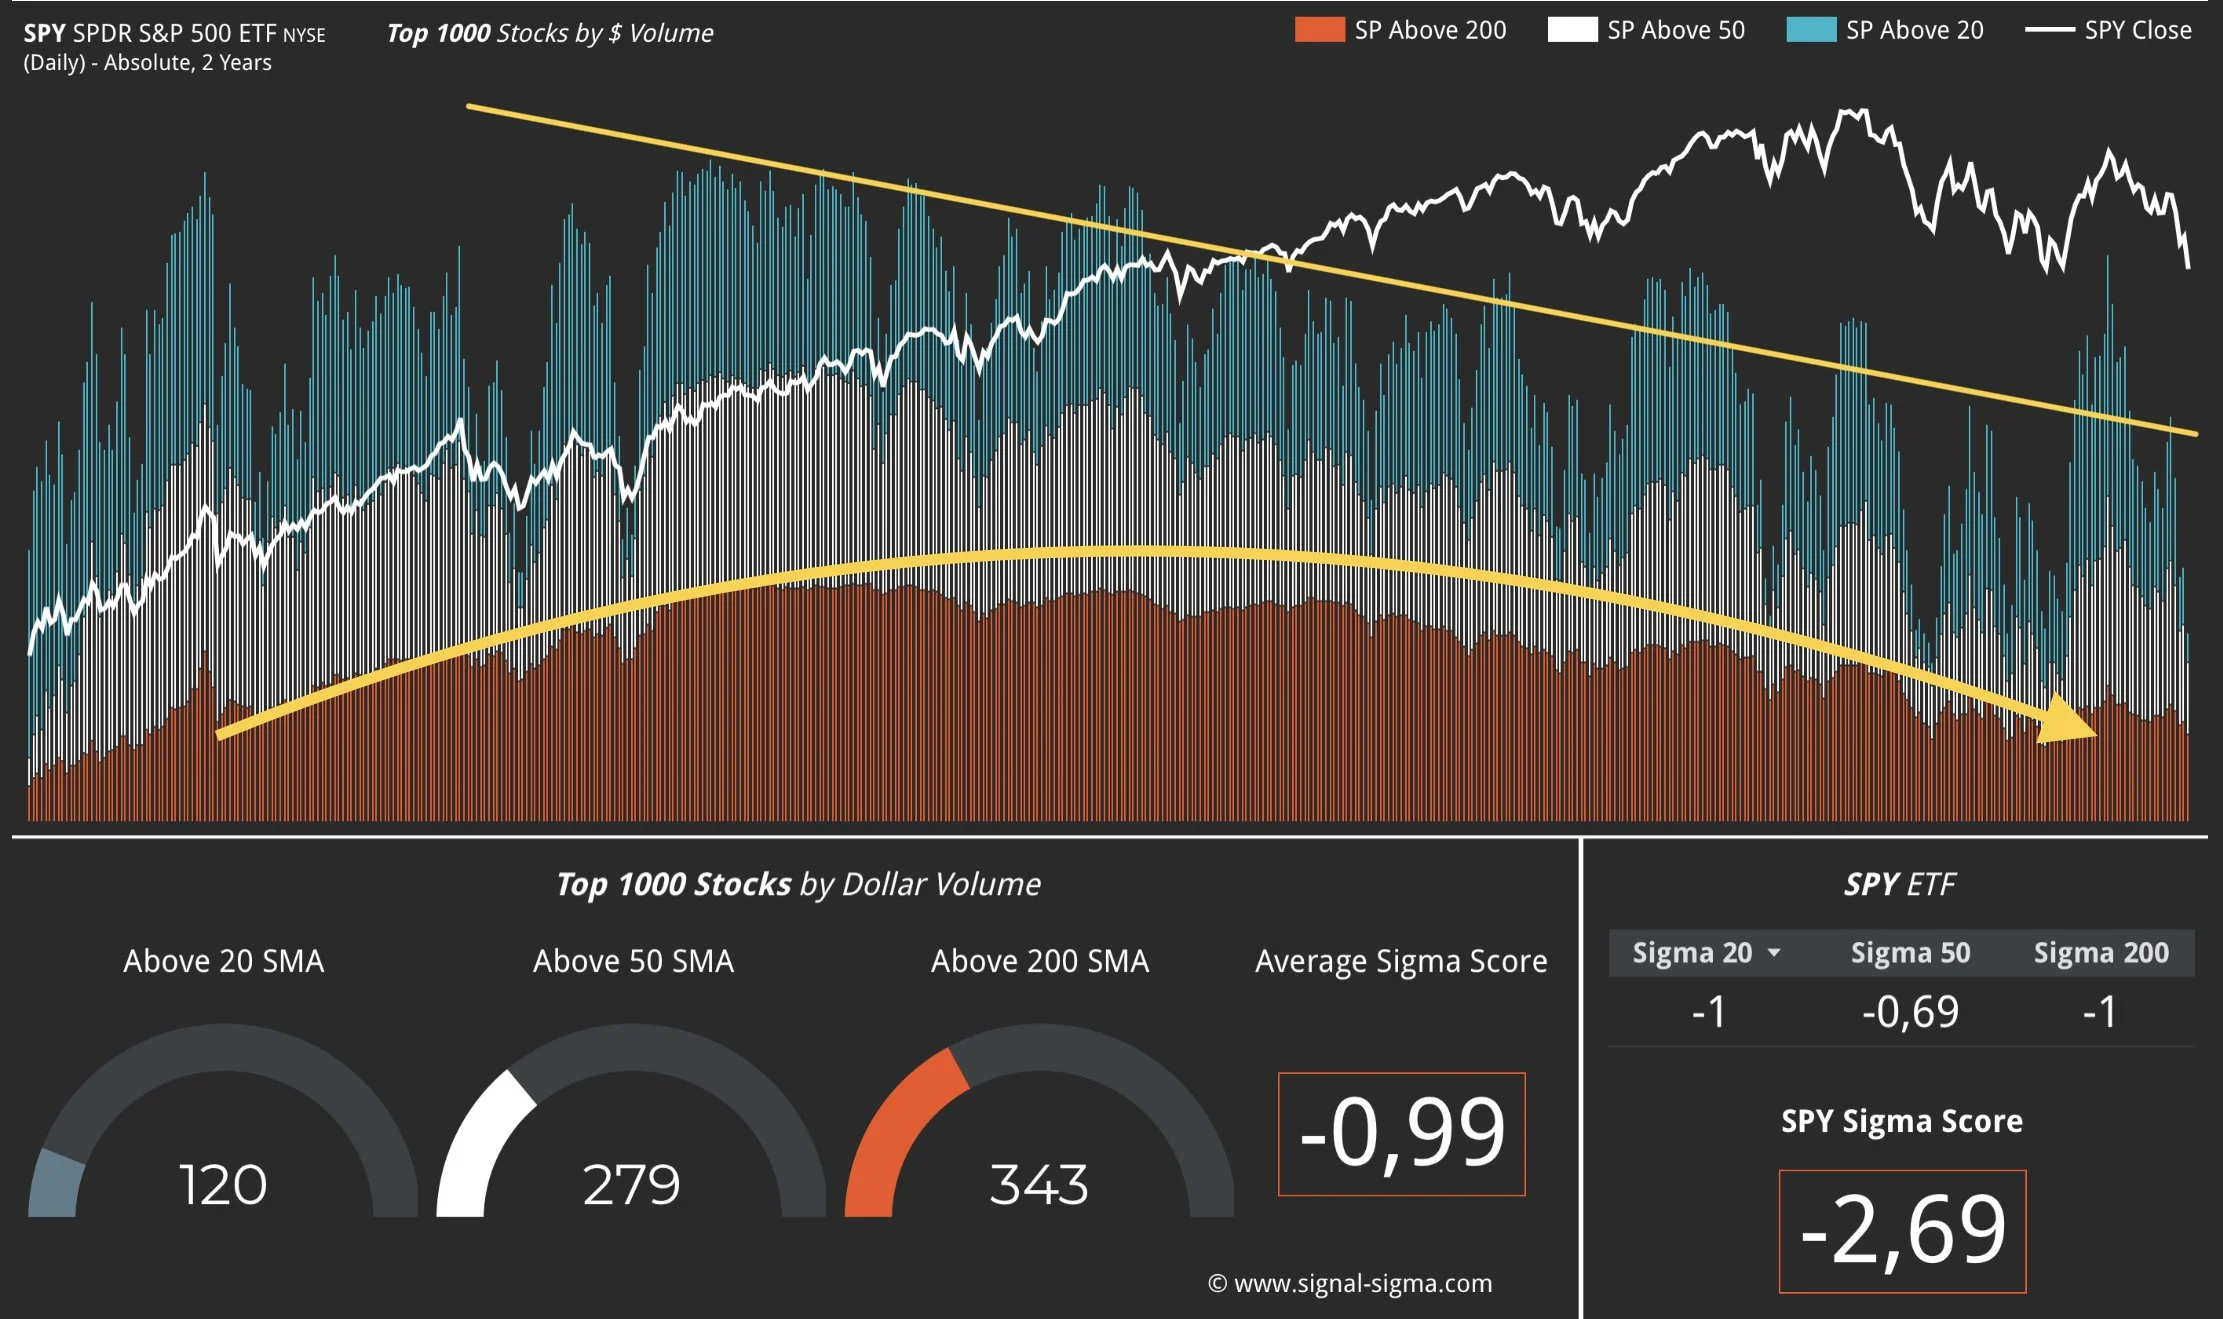
While studying moving averages for a single stock is a fruitless endeavor, looking at the market as a whole can give you better perspective. In a way, price averages work like “gravity” or like a rubber band - at some point, they will “pull you back”. This chart plots the number of stocks above key averages for the top 1000 stocks by dollar volume.
The broad perspective that we see is one of declining breath. Less and less stocks are able to hold on to their previous average price levels. This is not a healthy bull market with high participation rates, but rather a market in decline, with only a couple of “major” stocks keeping indices afloat.
Dollar Volume Perspective

Keep in mind transactions are always happening. Buyers will always meet sellers. The question is at what price and in what size. This chart overlays dollar transaction volume average for the top 1000 stocks onto SPY’s equity curve. In the lower panel, we plot absolute percentage change, so we get a picture of volatility as well.
I can only describe the current situation as “neutral”. Transaction volume has been picking up lately, but not in a convincing fashion. There’s no spike in volume to cement a new trend and no valley that would indicate the current move has run out of steam. We’ll need to keep an eye on this indicator the following days. Volatility is showing clear signs of increasing.
TAKEAWAY
Market internals paint the picture of a transition episode. This transition is a process, rather than a sudden event, as cracks gradually begin to show in the previous bull market. While this process might as well be a consolidation and nothing else, it at least pays off to be prudent at this juncture. There is a real risk that something very wrong can happen very fast. If such a crash suddenly occurs headlines will read “no one could have seen it coming”. In reality, all the signs were there.
In the short term, oversold conditions and negative sentiment are net bullish. Taking profits from hedges makes sense right now. Initiating long positions for trading purposes can also work out well.
Medium and longer term dynamics are not looking bright however. While bear markets are only recognized in hindsight, they contain lots of rallies and opportunities to be long. Catching falling knives in this environment however, is something we would not recommend.
Andrei Sota
Like what you see? Try Signal Sigma Risk Free for 30 days!