Market Report / June 14 2022
This article is written by our research collaborator, Mr. Andrei Nita, CFA L2, on the subject of current market developments.
Why the FED might be Wrong
Let’s start with a quick wrap up of last week:
While we were right about the market rally and our initial best guess in terms of target was on point (4200 on SPX), we were wrong with a potential continuation to 4300-4400. Spotting exact peaks is a hard line of business, so we advised for a reduction of risk exposure, as we also did gradually in portfolios. The trigger for this week’s selloff was Friday’s CPI report, which came in much hotter than we were expecting (8.6% YoY, est 8.3%). We have warned our readers that we started to lock in profits and as targets were achieved, and managed to close many or our long positions very close to the peak, the rest of them being close on break even as our stop losses were triggered, around SPY 408.

As a consequence to the high CPI numbers, participants started to price in more rate hikes and as of now there is 99% certainty for a 75bps rate hike on Wednesday and a terminal rate of 3.5%-4% by end of the year. The latter in our view is an extremely low probability scenario due to the already highly stressed credit market. We don’t yet have the numbers for CDS and OAS, but yields have had one of the biggest advances in history in terms of % changes. 2Y/10Y has inverted again on Monday, and with the 10Y yield sitting at more than 3.43% (2018 peaked at 3.2%, when debt levels were significantly lower than today), corporate debt refinancing will begin to create especially big problems. Mortgage rates have already spiked closer to 6% and the demand for mortgages has plummeted to levels associated with extreme market stress (a sign that RE market is cooling down rapidly):

Shall the yield continue to rise, don’t be surprised if defaults start to appear here and there. While the FED might not be as interested in the stock market as before (although midterm elections are fast approaching and a crashed stock market won’t bode well), they are certainly watching how yields are evolving. Remember, only the short end of the curve is a reflection of the FED monetary action, while the long end of a reflection of the economy.
30 Day Risk Free Trial
Try our Research Plan and see if it’s right for you.
By looking at how the various asset classes have performed over the last week, it appears that these are the first days of stage 3 (out of 3) of a bear market drop, where everything gets sold off in the desperation for cash (no places to hide). On Monday, the down volume (DVOL) for NYSE was 98%, in other words 98% of NYSE volume transactions were on the selling side (Nasdaq had 89% DVOL). The selling was exacerbated as market flipped to negative gamma territory when SPY broke the $400 level (more selling pressure from the dealers who are short these record amount puts opened over the last month; something we have highlighted several times already).
Looking at volatility, as of Monday’s close, we are starting to see volatility risk premium (RP) being built: SPY RP +11.07%, QQQ RP +2.5% and IWM RP +11.67%. In other words, IWM and SPY are the most attractive if one wants to add some long exposure in the hopes for a relief rally after 4 days of -10% drop in SPY. These figures are also confirmed by the Equity Put/Call Ratio which reached a post-pandemic high:

Form a statical stand point, the average current drawdown of stocks is at 32.2%, with 427 companies (out of the biggest 1000 companies) into 2 St. Dev oversold territory (assuming a normal distribution, in only 5% of cases we see more then 2 St. Deviations). The average 1000 biggest companies are also showing Oversold conditions. As for SP500, it sits right on 2-year Linear Regression 2St. Dev lower bound and at 3 St. Dev from the 200MA (both were historically good buying spots for at least a relief rally. The options market show that some target for such a scenario, given by the max pain theory, would be $397 for SPY and $300 for QQQ.

Turning back to CPI, if one was to strip out all the energy related constituents (like air fares, delivery services or moving/freight), the figure would be around 4% instead of 8.6%. This confirms our proprietary analysis that the current bout of inflation is driven by energy costs (Oil prices predominantly). A second major inflation driving force is transportation, but that is also linked to Oil prices. The wave component, which as mentioned by many experts, has already shown signs of easing in the last BLS report (more details were given in our last week’s write-up). For this exact reason, we believe FED has already made at least two two policy mistakes. On average there is a lag of 4 to 6 quarters for rate hikes to have a full effect on the economy/inflation. Hurrying to raise now by 75bps, will only make things worse. Recall that for Q1 the GDP was -1.5% and Q2 numbers have been constantly revised lower. Atlanta FED GDP Now is forecasting 0.9% (they also had a +0.1% est. for Q1, so their accuracy is questionable). Therefore, raising rates aggressively to tame an energy driven inflation will only destroy even more demand and will shrink the economy over the next 12M, while inflation will be only slightly tamed. For this exact same reason, we believe the market is very nervous and we can see many great companies being valued at levels which would only make sense during stagflation. Negative economic growth is also confirmed by the BofA fund manager sentiment survey:

While it hard to spot exactly the point where the FED will reverse course, we believe that point is now closer than before. Given current circumstances we would not allocate aggressively (yet) to any long exposure, only sporadically in certain stocks where valuation is absurdly low.
Shall the volatility risk premiums into indexes reach extreme level (+30% RP), depending on what economic news we will receive in the meantime we might increase again our long allocation. However, covering shorts gradually would make sense from here as the risk for a real bear market rally is rising again. Below you can some examples of historical bear market rallies and how vicious they can be:
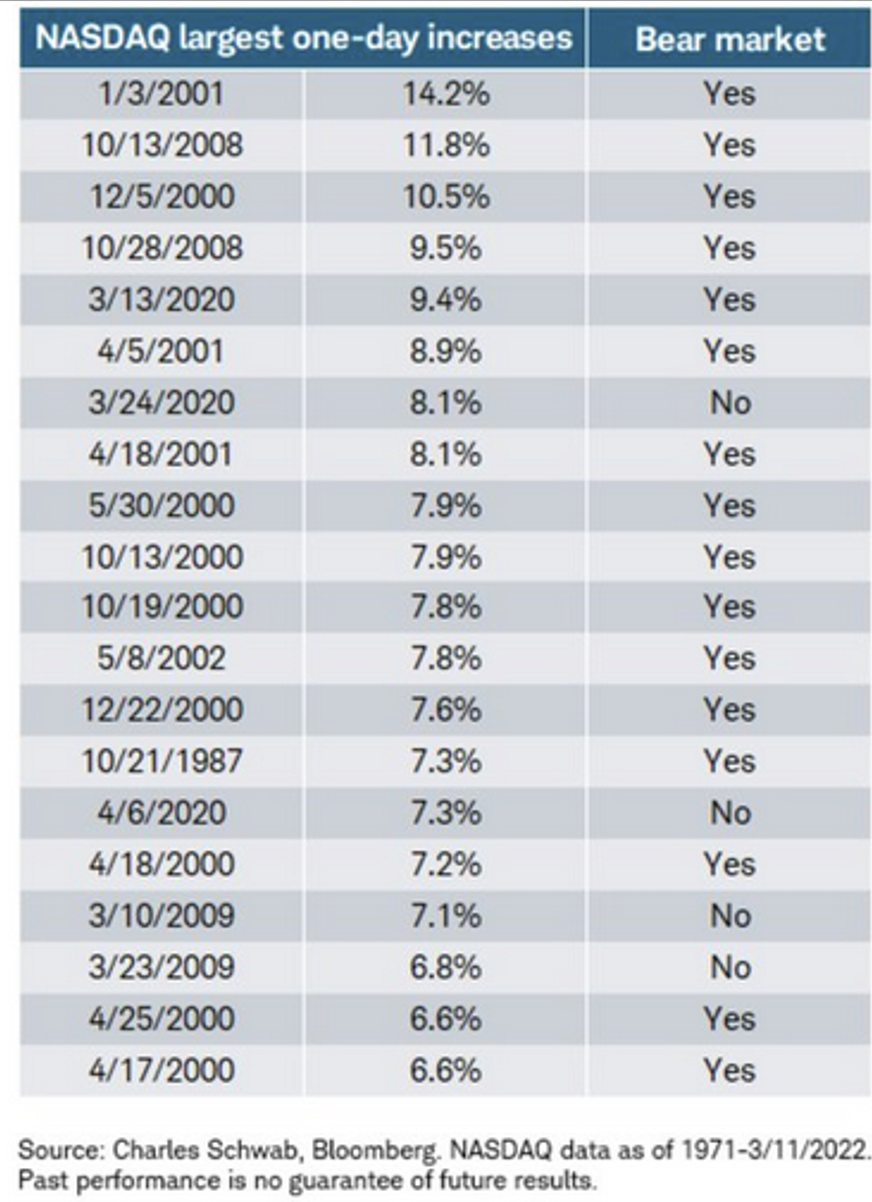
Note: these are examples of one-day percentage moves up.
Get market updates in your mailbox as soon as they become available. Sign Up to our Press Account.
CONCLUSION
In conclusion, while we keep our long stated fundamental bear market view, we also believe that the best approach at these levels is to be rather neutral (high cash allocation), as this selloff can continue indiscriminately. There are also signs that a potential rally is building up underneath the surface, but we would use those rallies to decrease exposures if you are excessively long, or start building hedges to cover your long positions.
Andrei Nita, CFA L2