Portfolio Rebalance / December 13
Following the Signal Sigma Process
Tuesday is the day when all of our strategies rebalance their asset class holding weights. The approach to this article follows the step by step process described here.
This week features a further reduction in targeted exposure for Enterprise and Nostromo. Our strategies plan to hold plenty of cash, as well as little exposure to stocks and bonds. I find this to be a very wise approach. If the rally is to continue from here on out (on today’s cooler than expected inflation print), then treading with caution is the best way forward.
Asset Class Allocation
The first step in determining optimal portfolio positioning is taking a look at the performance of the main asset classes, and determining which are suitable for investment. The Asset Class Overview Instrument gives us a clear macro picture.

SPY’s trend has turned - from Up-Trend to Down-Trend; while currently close to flat, the slope change will affect the way our systems treat equities in the allocation process; Commodities are barely holding onto support at the lower trend-line.
According to our methodology, all major asset classes would be fit to receive allocation from our system: Equities, Treasuries, Commodities and Gold.
The US Dollar has consolidated, and is still oversold from prior levels. We will modify the assumptions used for the technical analysis below with more realistic assumptions than currently implied by the price action: CAGR set at 5% and a Price Target of 30 for UUP (USD bull ETF).
The prospect of a weaker US Dollar exists, but the downside appears limited. With today’s weak CPI print, we could see the Dollar break immediate support ($28 on UUP), and head much lower to the next level of support. This would probably coincide with the resurgence of a “new bull market” narrative.

Upside for UUP is at 29.24, with good risk-reward. Whatever happens next, weather a bounce or a breakdown, will most likely set the tone for the next couple of months.
We are still trading in an environment where there is a high negative correlation between the USD and every other asset class combined. The disposition of investors to choose between CASH or ANYTHING ELSE so categorically suggests to us that the bear market can rear its head at any moment (and we should not be surprised).
As soon as this correlation regime breaks down, we will be able to take risks more freely.

Enterprise has closed out the position in Commodities last week. The targeting logic will reduce the planned exposure to SPY from 90% to about 8%, in the event a BUY signal triggers.
For now, the strategy enters the week with a 100% CASH allocation.
The Enterprise Strategy

Enterprise, our most conservative model, plans to initiate a position in SPY and TLT on the next available BUY signals for each instrument.
Since this model only trades 4 asset class ETFs, we use it to judge overall portfolio positioning.
Equities are targeted for allocation at 8% of portfolio value. This starter position will be bought on the next available BUY signal for SPY that DOES NOT VIOLATE support at the lower trendline ($383).
A signal could trigger this week, in the form of a MACD BUY crossover. If triggered, it would indicate the consolidation phase has completed, and we could see higher prices from here on out (a Santa Rally maybe?).
Treasuries are targeted for allocation via the TLT ETF, at 7% of portfolio value. Getting a BUY signal for TLT is still highly unlikely, because both the MACD and the WR% are very extended and short term overbought. We would need to see a consolidation first, a phase that we will most likely go through at the start of next year.
Cash reserves (USD) are currently at maximum - 100% CASH.
2. Sector / Industry Selection
The next step in creating our portfolio positioning is to break down each broad asset class into more granular groups of assets. This will help us understand which pocket of the market is outperforming or underperforming and make our selection accordingly.
Since Equities are now a viable asset class for investment, we will first take a look at how the different Factors are performing and see if there are any notable opportunities.

On the Factors front, we are noting a further cool-down for the performance of most factors. The Dow (DIA) is still the most extended overall, but developed market non-US stocks (EFA etf) are also enjoying a lot of momentum. Small Caps (SLY) have slipped below their 200-day Moving Average, while Momentum (MTUM) and Mid-Caps (MDY) are now trading below their 20-day Moving Averages.
The interpretation here is that selling pressure is eroding the broad momentum enjoyed since the October lows, and prices are starting to normalize.
Similar to last week, with the exception of QQQ (Tech), IVW (Growth), every equity factor has been outperforming the S&P500 (See Z-Score Relative column and the positive pink columns in the right panel). This would give us plenty of options to choose from, if there would be any dip to be bought. However, all factors are trading above their 50-day Moving Average, and there is no such opportunity to be had for the moment.
The plan is to wait for more selling pressure to accumulate and put these factors to the test. Then we can determine which of them are trading with a Relative Z-Score in positive territory AND are still holding above the 50-day Moving Average,
While most factors have lost steam in the past week, a rotation scenario would still imply money flows to the under-performers (QQQ, IVW). So far, we haven’t seen their performance pick up materially versus the other factors, but it’s something to keep an eye on.
The same situation is found when looking at Sectors as well.

There are signs of selling pressure in the sectors space as well. The only beneficiaries have been Real Estate (XLRE) and Utilities (XLU) to the detriment of most other sectors. Notable movers to the downside include Energy (XLE), now trading below it’s 50-day Moving Average, and Communications (XLC) with a much more benign deviation from its averages.
The current set-up signals an overall Risk-Off environment despite the bullish overtones implied by the reaction to the CPI numbers.
The only sectors trading below their 50-day Moving Averages are XLY and XLE (new entry). None of these sectors are relative out-performers (Z-Score Relative is below 0 for both). As a consequence, Nostromo’s selection process skips sectors and instead chooses SPY for long allocation purposes.
The same logic applies to bonds as well, with TLT being targeted. No other bond factors are out-performing.
The Nostromo Strategy

Nostromo, our tactical allocation model is starting the week with 100 % cash positioning.
The strategy will perform almost identically to Enterprise this week, with very similar targeting and the same signal logic.
For more info about how Nostromo targets sectors or factors within a broader asset class, read this article. The first part sheds some light on the selection process going on in the background.
3. Individual Stock Selection
This week, our focus for stock selection will be the Momentum + Quality Screener. Similar to the way Horizon’s stock screener works, this instrument focuses on the following selection criteria:
Piotroski F Score => 6; this ensures Quality
6 month & 1 Year Absolute Returns > 0; a basic momentum requirement
Sharpe Ratio > 1; very favorable risk-reward
Z-Relative > 0; stock outperforms its benchmark ETF
MACD Trend is Positive; medium term momentum is trending up
We have set “Z-Score Relative” on column A and “Sharpe Ratio” on column B in order to plot these metrics against one another in the scatter chart (lower panel). This way, we can focus on stocks that score highly on both metrics.
Here are the results:

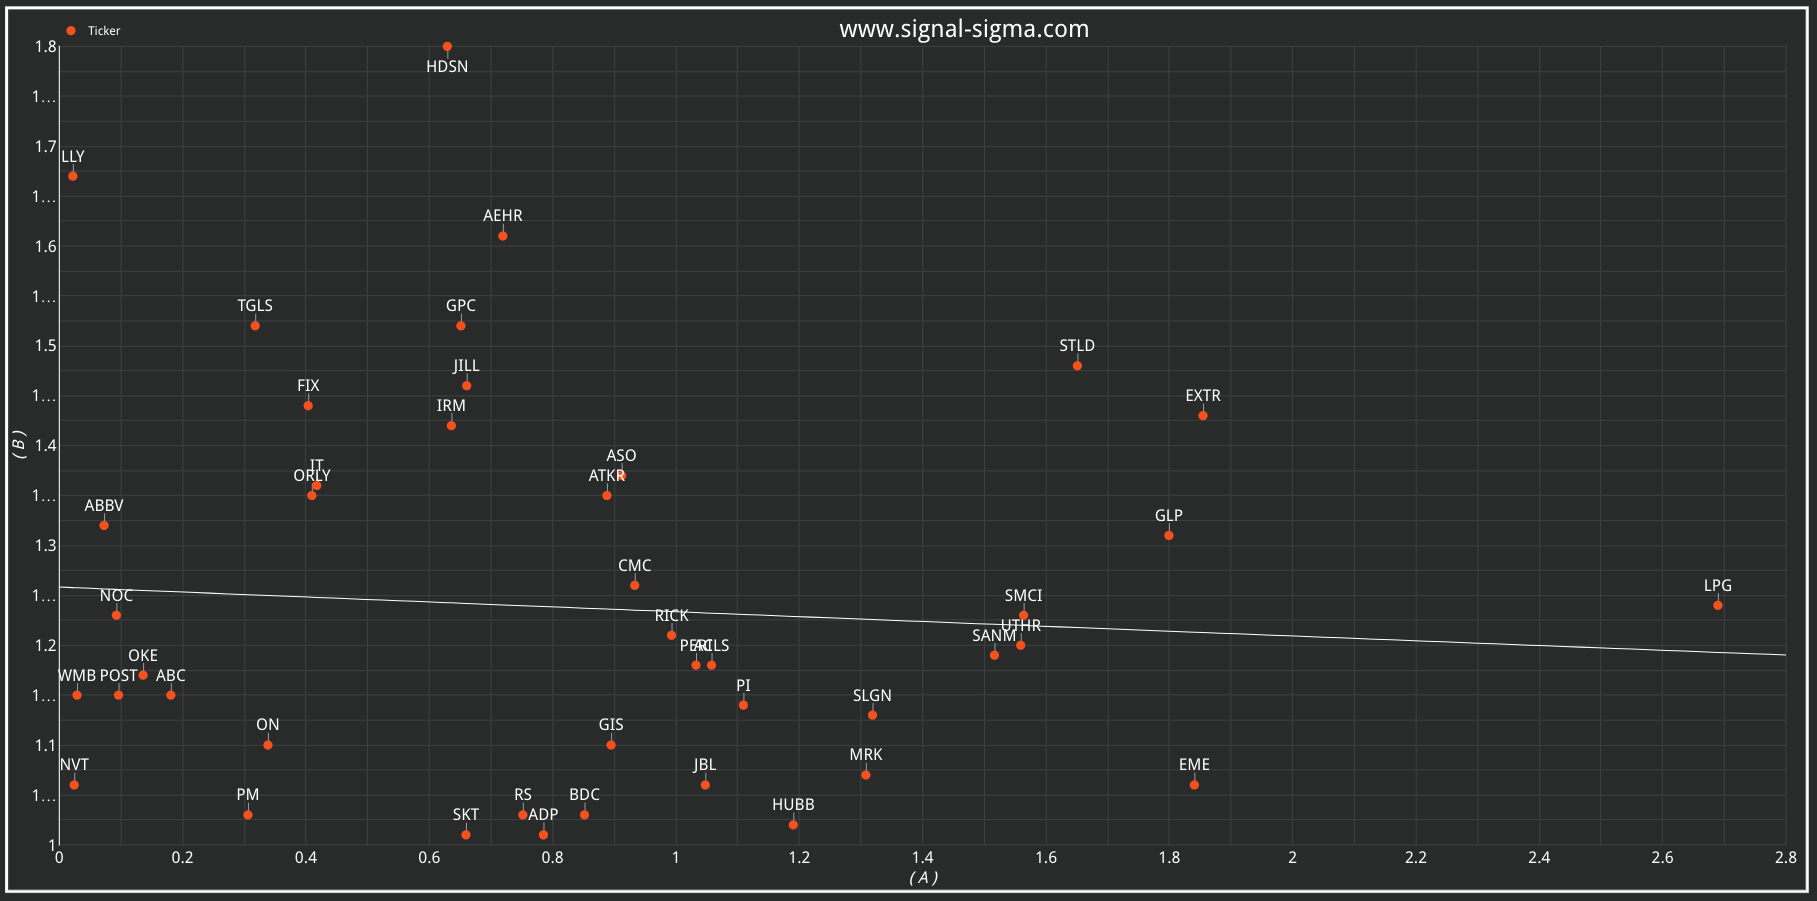
While plenty of tickers make the list, I would focus my research on those “above the line”. Names like AEHR, LLY, STLD, EXTR, GPC, ABBV stand out to me from this list.
At current levels, Horizon will form a portfolio of 10 stocks and rebalance them at the close. This model is the most aggressive and has no need for any other confirming signals. It will take it’s allocation framework from Enterprise and Nostromo meaning the 10-stock portfolio will be reduced to an overall 8% exposure.
Horizon Strategy

Due to an issue with our data provider, the Horizon strategy has not rebalanced yet. We will update the article once the issue is resolved.
We are very sorry for the inconvenience.
We do know for a fact that Horizon’s equity exposure will go down to 8% from last week’s 90%, due to the model’s reliance on the same allocation framework of Enterprise and Nostromo.
Horizon’s equity portfolio will be primarily correlated with the Industrials and Basic Materials sectors - showing the best momentum so far. It should be noted that Industrials seem overbought at this point (BDC, EME, EXTR, RMBS and SANM positions).

4. Market Environment
The next step in our process is to take into account the type of market environment that we are currently trading in. For these purposes we use the Market Internals and the Market Fundamentals Instruments. Comments on the overall state of the market can usually be found in our Weekly Preview Article.
Overall, we find that conditions are still Overbought and extended both on a market-wide basis and an individual stock basis, even ahead of the CPI print and the Fed interest rate decision. It seems market participants have front-run the inflation report successfully and have asked weather the numbers have “leaked” ahead of the release. We note the same bullish and bearish drivers from our Market Internals Analysis.
Bullish Signal in Stocks trading above their 200-day Moving Averages

The 2 times stocks have established short-term peaks, we recorded 497 / 1000 stocks above their 200-day MA on August 16 (the peak of the previous rally), and registered 572 / 1000 stocks 2 weeks ago. Right now, the numbers are weaker across the board, with 492 / 1000 stocks trading above the 200-day Moving Average. This is still a respectable value, one that signals consolidation around recent strength.
Since the start of 2021, while SPY was rising, the number of stocks above the 200-day MA was slowly grinding lower in what is known as a bearish divergence. Now, the opposite is occurring. This improvement in breadth is undeniably a bullish divergence.
Bullish Signal in Market Internals Z-Score

Another bullish divergence can be observed in the average Z-Score of a stock in the market versus the Z-Score of the SPY itself (the Z-Score measures how many standard deviations a certain reading is above or below a computed trend).
While the SPY’s Z-Score readings have been grinding lower and lower since the start of the year, the average stock is faring much better. The divergence in Z-Scores starting in the middle of June is obvious on the chart. Put simply, the average stock has been doing much better than the SPY itself. Again, an undeniably bullish development below the surface. This divergence is persisting this week as well. It will be interesting to see this put to the test in a downturn, as the divergence is significant.
Bearish signal in Average Dollar Transaction Volume and Volatility

Dollar transaction volumes have been trending lower, as the Fed removes liquidity from the market. There has been little change in the trend for dollar volumes since QT started. Once financial conditions are eased, we should see volumes and market liquidity start to move up again.
Simply put: people (+funds and banks) are taking money out of their brokerage accounts and 401k’s. If there’s less money to invest, there’s less of a push higher in prices. All other things being equal, less liquidity and higher volatility mean lower valuation premiums and prices.
In conclusion, if Enterprise or Nostromo start to get long equities, we will close all short positions in the Sigma Portfolio and start to tilt bullish as well. Such may be the case this week, as the MACD signal on SPY might turn bullish after the CPI release.
5. Trading in the Sigma Portfolio
After reviewing all of the above factors, it’s time to decide on the actual investing strategy for our real-life portfolio.
First of all, we will take an average of CASH position sizing from all of our models. This will come down to roughly 95%, with a minimum and maximum of 85% and 100% respectively. We are at a stage where our models are in dissonance with each other in terms of actual allocation, but starting to converge on the same target portfolio.


The Market Environment view is still defensive this week. While taking note of bullish developments below the surface of the market, we need to wait and see how the rally performs post CPI announcement.
The Sigma Portfolio is currently allocated 9% Long, 21% Short equity exposure. We will let the market (and our systems) dictate the next move.
If Enterprise and Nostromo will get long equities, we will close all short positions in the Sigma Portfolio and leave the long positions intact. Such may be the case this week, as the MACD signal on SPY might turn bullish after the CPI release.

According to the Correlation Screener above, the Sigma Portfolio contains positions primarily correlated with the Value Factor (IVE) and Mid-Caps (MDY).
Andrei Sota