Weekly Preview / December 19
Notable Events on our Weekly Watchlist:
Monday: N/A
Earnings: N/A
Tuesday: Building Permits
Earnings: NKE, BB, FDS, GIS
Wednesday: N/A
Earnings: MU, RAD
Thursday: Initial / Continuing Jobless Claims
Earnings: KMX, PAYX
Friday: Personal Spending / Income, PCE Price Index,
Earnings: N/A
ETFs to watch: SPY, TLT
Where Santa?
Last week was a textbook chance to experience the advantages of a rules based approach to portfolio allocation and trading. Our entry (and exit) requirements did not let us fall into the trap of intra-day (and day to day) volatility. And there was a lot of volatility to talk about!
On Tuesday, the market rallied hard after the softer than expected CPI report. SPY was up 3.5% in Pre-Market trading on the YoY cooler inflation number (7.1% v.s. 7.3% median projection). The surge did not last long, however, and a lot of that initial price gain was wiped out by the end of the session. The next day, Powell’s speech and the FOMC’s rate hike decision took the main indices lower than Monday’s close. Investors started to realize that the Fed has no plans to “pivot” in 2023 and have penciled in one more rate hike than what is currently priced in. The week ended with two consecutive down days, and OPEX Friday closed a disappointing week for the bulls. SPY is now firmly entrenched in between two important levels, none of which have been breached so far.
SPY Analysis


The MACD signal is clearly in negative territory, warning against any premature buying of an upside move. We are yet to see the real conclusion of the current price action. SPY is short term oversold, however, managing to hold onto the range support level (382). This could make for a viable short-term upside move, into the end of the year and the first week of January.
Portfolio Window Dressing
The final two weeks of December and the first week of January are often marked by positive stock performance as investment firms adjust their portfolios for year-end reporting, and the start of the New Year sees significant investments in financial assets. This pattern, known as "window dressing," was first identified by Yale Hirsch in his 1972 book "Stock Trader's Almanac." Hirsch noted that the S&P 500 index had gained an average of 1.5% during this seven-day period from 1950 to 1971. The trend has continued to the present day, with the S&P 500 averaging a 1.3% increase since 1950.
This year, it seems the pattern can hold true yet again, with the market being oversold enough to elicit a short-term bounce. We will regard any rally attempt as an opportunity to reduce exposure in our long positions, seeing limited upside.
Trading volumes have confirmed the price action this past week (Market Internals / Volume). High dollar transaction volumes tend to add conviction to any directional price action, as buyers and sellers agree to transact at the prevailing market price. It is when volumes drop that we see an “exhaustion” of the current move, and can begin to speculate on a counter-trend move. The long term trend in lower transaction volumes is intact, however - the Fed’s QT program is running at full steam, and draining liquidity from the financial system.

With our Market Internals Overbought / Oversold indicator no longer in extreme territory, the market is showing a neutral reading in the medium term. There is no significant divergence between the breadth score (48 - an average of the top 1000 stocks) and SPY’s score (42).
By looking at the chart, we could take the view that there is more downside than upside available, but barely so. This particular instrument is less useful to us when in a neutral state.

The Fed remains Hawkish, but markets play “Chicken”
The Federal Reserve will largely determine the market's performance in 2023. As interest rates continue to rise, the risk of causing economic damage increases. Even a typical recession would likely lead to lower earnings projections and, as a result, lower asset prices.
Throughout the year, investors have held onto the possibility of the Fed changing its approach. However, Fed Chair Jerome Powell has consistently indicated that this will not happen. In November, the market saw a 5.5% increase following the October inflation report and a 3.1% increase after Powell spoke at the Brookings Institution and discussed the possibility of slowing the pace of rate increases in December. Both of these rallies were subsequently undermined by the Fed's actions and Powell’s speech.
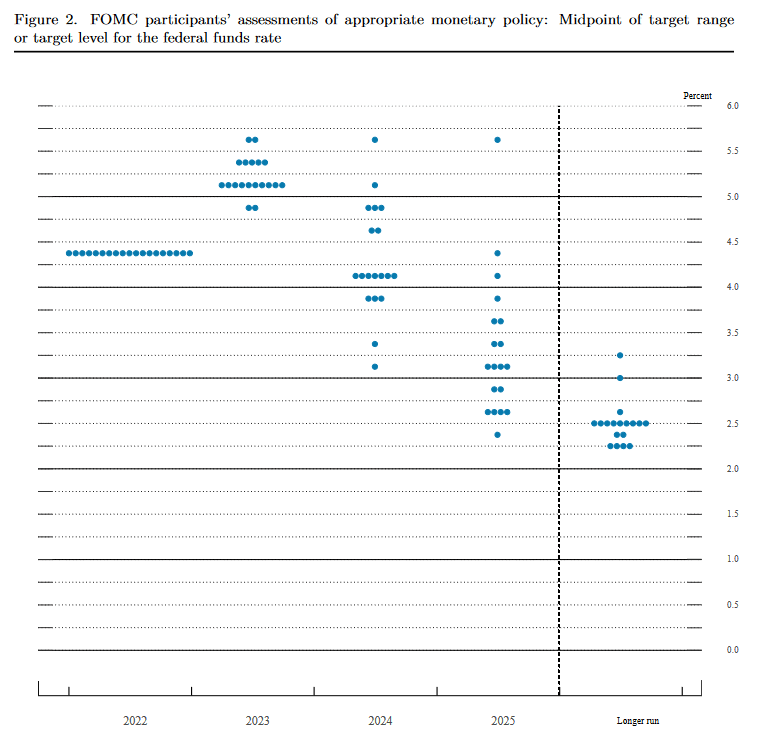
According to the Federal Reserve's latest policy statement, the central bank is not yet finished with its efforts to control inflation. This was also evident in the "dot plot," which showed an increased likelihood of higher interest rates in the coming year, with projections ranging from 5.1% to 5.3%. This suggests that there could be three more rate hikes of 0.25% each in 2023.
The market is currently pricing in 2 more hikes and a mid-year pivot move. Hence, the game of “Chicken”.

As evidenced in the image above (courtesy of CME’s FedWatch) the market is pricing in rate cuts starting in September. The Fed’s own projections indicate 0.5% GDP growth in 2023 (down from a 4% projection in 2020). That is code for “soft landing” as well as “highly probable recession”.
The Fed’s only means of convincingly reducing inflation to a 2% inflation rate, would be to induce a demand slowdown. This would likely result in slower economic growth due to higher unemployment and slower wage growth. But the FOMC can’t just come out and say “We’re going to have a recession in 2023”. Markets would sell off, investors and consumers would panic, and the economy would crash.
What the Fed is doing in essence is “boiling a frog” (if a frog is placed in a pot of hot water, it will immediately jump out. However, if the frog is placed in a pot of room temperature water and the temperature is gradually increased, it will not notice the change and will remain in the pot until it boils to death).
By enacting a slow and incremental change in financial conditions, the Fed is trying to engineer the same sort of dynamic in order to bring inflation down. Their credibility rests on the success of this operation. And credibility is the only real asset that a Central Bank has.
Takeaway
Risks are currently tilted towards weaker economic outcomes, given the Fed’s ongoing monetary tightening. We are inclined to reduce long exposure on a “Santa Rally” and add to hedges if a breakdown of the current trading range occurs. A reduction in “longs” will only affect net exposure incrementally in the Sigma Portfolio - a small change.
There is no need to make any more significant exposure adjustments until we break out of the current range in either direction.
Andrei Sota