Portfolio Rebalance / March 14
Following the Signal Sigma Process
Tuesday is the day when all of our strategies rebalance their asset class holding weights. The approach to this article follows the step by step process described here.
If you didn’t get a chance to test it yet, the new Valuation Wizard Instrument is now available! Fundamental Explorer got a massive speed bump as well!
This week features our strategies massively reducing targeted exposure to equities. SPY broke its key level of support on Friday of last week, and yesterday the bounce did not manage to reclaim it. Enterprise has so far managed NOT to get trapped in this latest bear market rally, due to the significant safeguards it has in place. Nostromo has gradually reduced the equity exposure it has accumulated, due to various STOP-LOSS breaches.
Asset Class Allocation
The first step in determining optimal portfolio positioning is taking a look at the performance of the main asset classes, and determining which are suitable for investment. The Asset Class Overview Instrument gives us a clear macro picture.

Cross-asset class volatility has increased in the past week, knocking out Gold and Commodities out of their respective technical channels. Equities have slumped to levels that make our allocation system extremely cautious. Treasuries seem to be the best positioned asset class, despite the fact they are contending with an important resistance level.
The US Dollar has broken below the key S1 level (now at $28.23). We have recognized the Dollar’s overbought condition before, and the need to consolidate before eventually heading higher. Uncertainty regarding the future path of interest rates in light of the banking sector’s fragility are giving investors time to pause and adjust their positioning. Gold was the main beneficiary of this slump, as well as treasuries, to a lesser extent. We will get a clearer picture once the CPI numbers are published and see the market’s reaction today.

We are constantly checking for a break in the current negative correlation regime between the US Dollar (white) and every other asset class, combined (orange). There is no meaningful such break as of yet, but the divergence we have noticed last week persists (circled).
Within the larger (and more meaningful context) of an inverse correlation, the recent price action seems to be divergent. Due to the influence of Gold and Treasuries, Multiple asset classes bounced convincingly, while the Dollar went nowhere. Given the significant events unfolding in the banking sector and potential intervention from regulators, we are ready to chalk this one up as an exception from the past environment, but there could be an interesting move brewing under the surface.
It seems that Treasuries and Gold are breaking with the negative correlation regime on their own, which could be bullish for both of these asset classes. Commodities and Equities remain under pressure.

Our strategies have decided to reduce targeted exposure to both stocks and bonds. The pullback of the US Dollar looks appealing, when viewed through our system’s lens.
The Enterprise Strategy

Enterprise, our most conservative model, is entering the week 43% long Treasuries, and 57% CASH.
Since this model only trades 4 asset class ETFs, we use it to judge overall portfolio positioning.
Equities are targeted for exposure at 8% of portfolio value (down from 48% last week), via SPY ETF. The position will be filled only if SPY manages to close above the M-Trend level of $395, and a BUY signal then occurs.
The model’s treasury allocation is complete for the moment, but positioning is meant to be reduced on a SELL signal. Treasuries are short-term overbought.
At 57% Cash is still the dominant position for this model.
2. Sector / Industry Selection
The next step in creating our portfolio positioning is to break down each broad asset class into more granular groups of assets. This will help us understand which pocket of the market is outperforming or underperforming and make our selection accordingly.
Since Equities are an investible asset class, we’ll take a look at how different Factors are performing and check for any notable opportunities.

What a difference a week makes! We have included both tables for this week and last week in order to help you compare developments (click on the arrows or thumbnails to cycle through the tables).
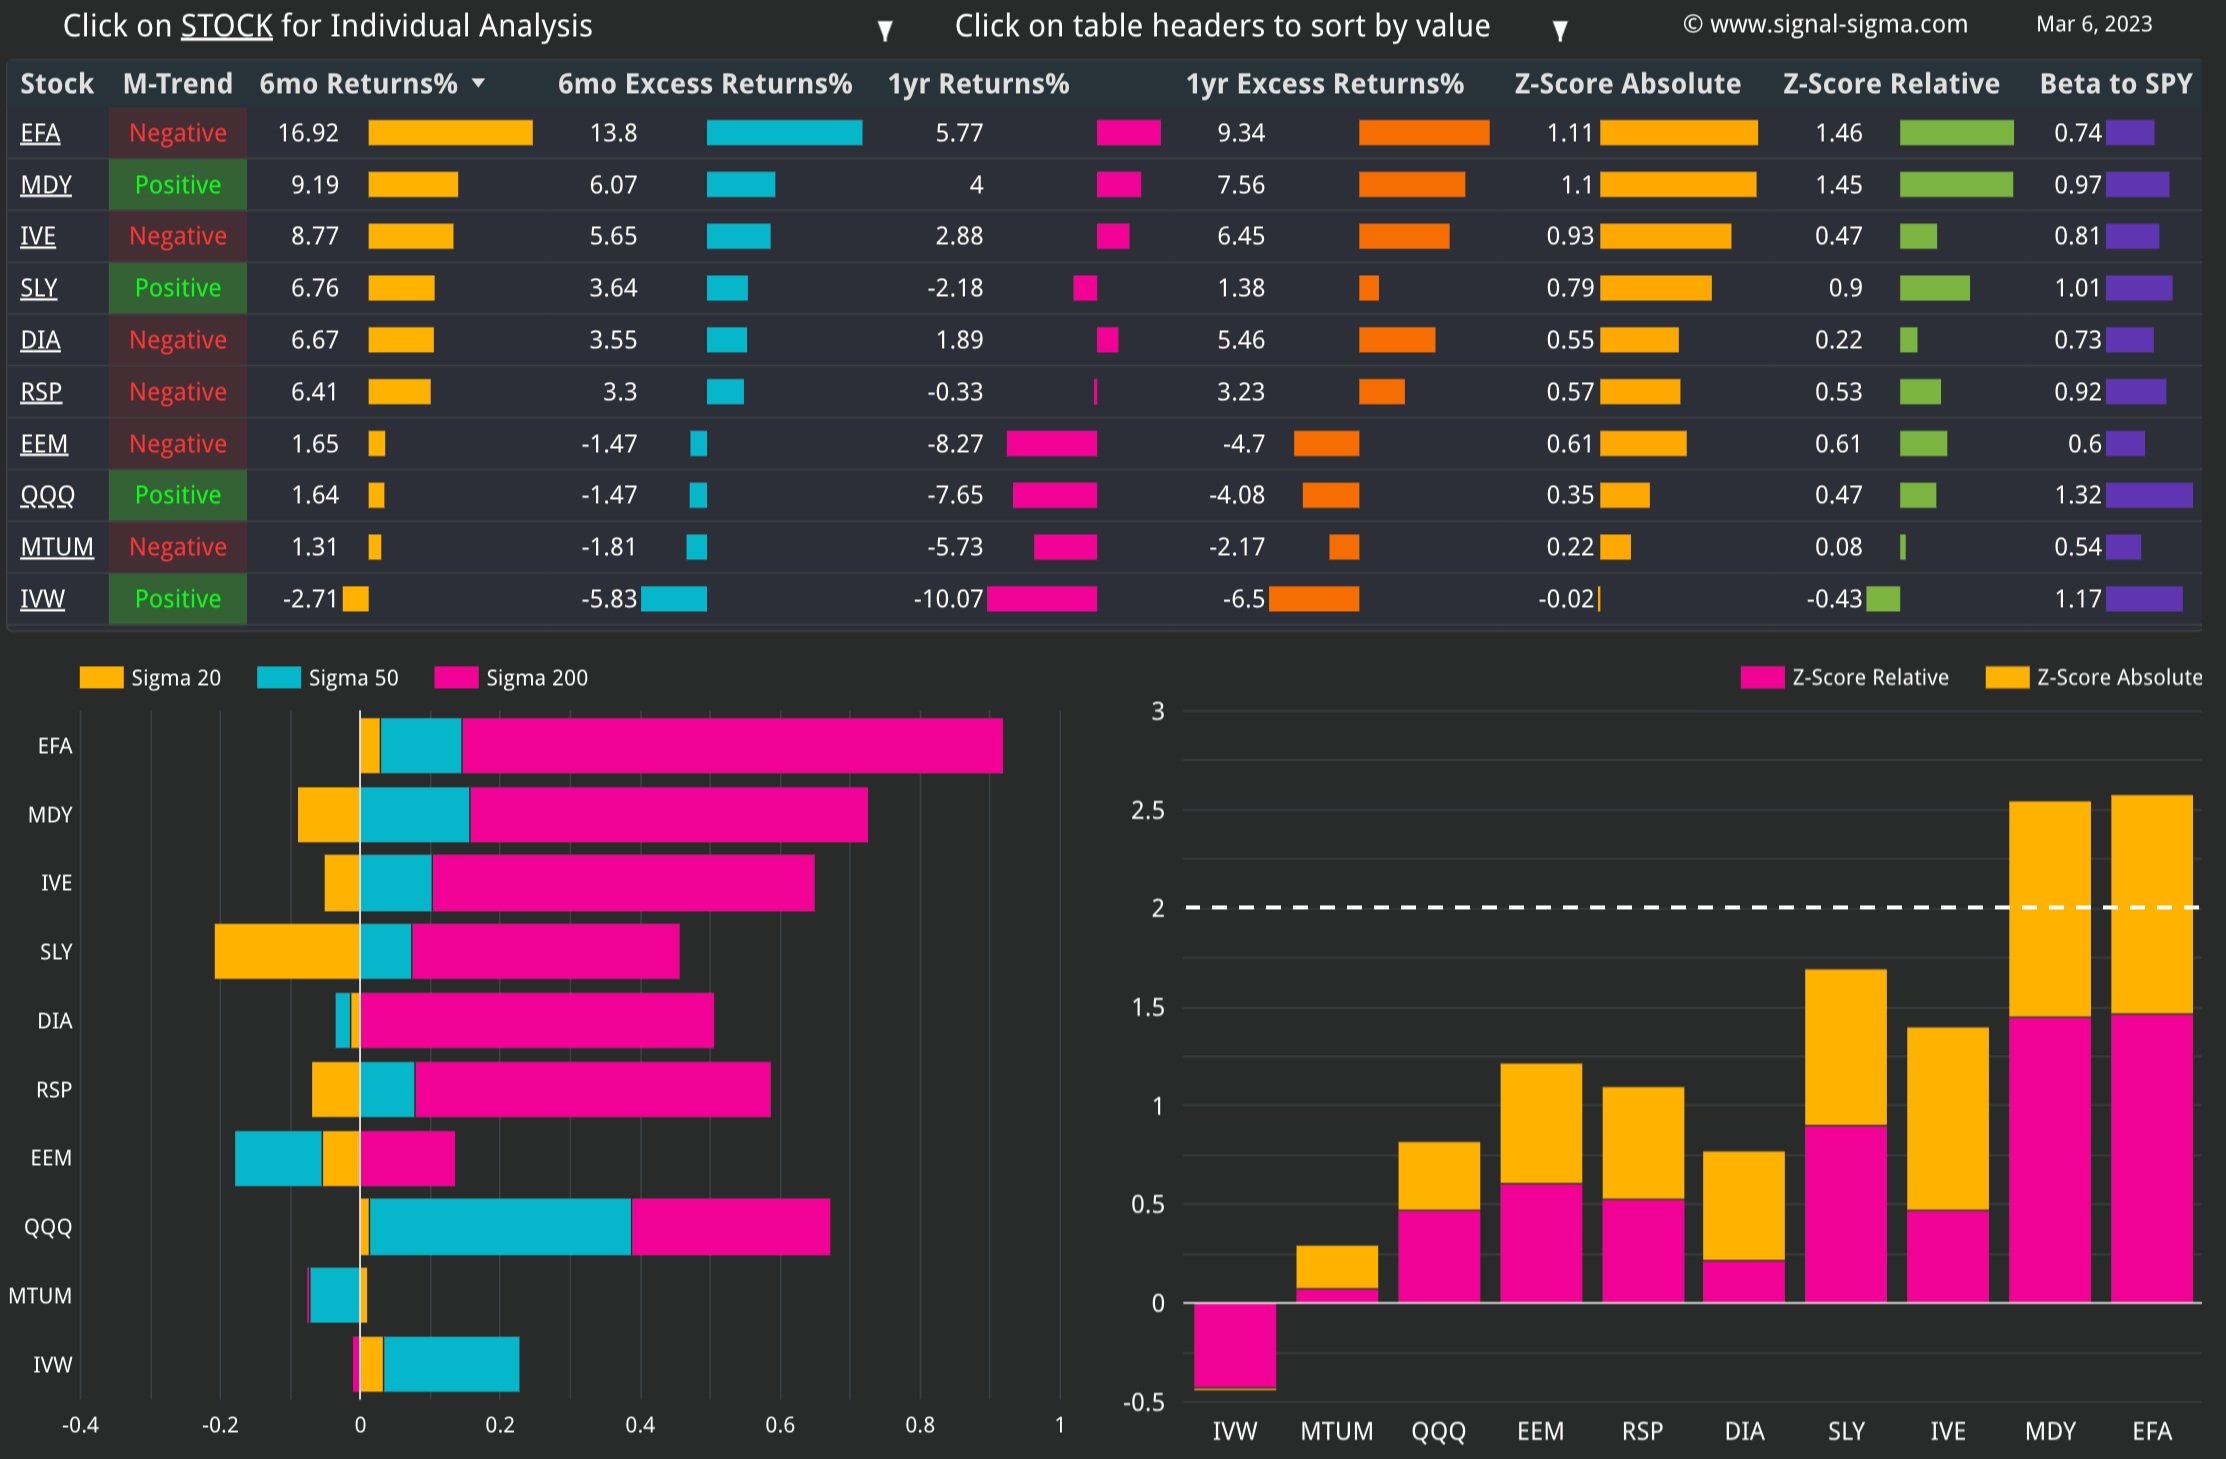
Most factors are now registering a negative Medium-Term Trend (QQQ and IVW being the only exceptions). Developed Emerging Markets (EFA) is the only standout factor, especially because of its relative-to-SPY Z-Score. The factor is otherwise not overbought. Also standing out due to its relative out-performance is QQQ, which is hanging on to its 200-DMA. It has also shown surprising resilience in the face of SPY’s swoon. All of the other factors are trading below all key moving averages. This leads us to identify a couple of opportunities.
By using our proven selection criteria (Z-Relative > 0, while Sigma 50 < 0), the following factors would make good investment candidates for a technical play:
SLY (Small Caps) - which are now extremely oversold
IVE (Value)
DIA (Dow Jones)
MDY (Mid-Caps)
EEM (Emerging Markets)
MTUM (Momentum Factor)
So.. that’s a lot of factors. To us, the best technical opportunities are in the Mid / Small Cap space, Momentum and Dow Jones ETFs due to their relative-to-SPY profiles (charted below).


Here’s how we stand on the Sectors front:


Like in the factors category, we have included last week’s table as well. The difference one week makes is worth watching.
Obviously, the financial sector’s collapse is sticking out like a sore thumb. XLF is now extremely oversold and deviated -from this perspective, a bounce would not be surprising. On the downside deviation note, signs of relative life are being flashed in Healthcare, Utilities and Staples. This is unsurprising due to their defensive nature which is favored during times of uncertainty. Our base case expectation is for these sectors to maintain relative outperformance going forward.
Industrials (XLI) have cooled somewhat, and while still elevated, are not overbought to the extent witnessed in the last couple of weeks. Technology looks like a winner as well, with strong relative performance, but little actual extension in terms of moving averages - merits attention on a pullback.


Taking all of these into account, Nostromo will select all of the outperforming factors for allocation: SLY, IVE, DIA, MDY, EEM. However, the total allocation of these equity factors will not exceed Enterprise’s overall allocation of 8%. Positions will be small.
On the treasuries side, MBB is slated for reduction, while TLT is preferred for exposure instead.
The Nostromo Strategy

Nostromo, our tactical allocation model, has been shedding the positions it has accumulated, due to STOP-LOSS triggers (MTUM, DIA).
The model is aiming to rebuild that equity position timidly, up to 8% of overall portfolio value.
Currently, only EEM is left on the books, with Nostromo looking to add SLY, IVE, DIA, MDY on their respective BUY signals.
On the treasuries side, Nostromo plans to allocate towards TLT on the next BUY signal. If the opportunity presents itself , it shall sell MBB.
For more info about how Nostromo targets sectors or factors within a broader asset class, read this article. The first part sheds some light on the selection process going on in the background.
3. Individual Stock Selection
This week, we would like to screen for dividend yielding stocks that are also relatively safe from a volatility and drawdown perspective. We shall use a completely custom screener for this approach:
Dividend Yield > 4%
Beta to SPY <= 0.75 (lower volatility than the broad market)
With a Current Drawdown < Average Drawdown (despite the current market environment, the stock is recovering)

The stocks above the yellow line stand out (their drawdowns seem well behaved). Names like IBKR, PM and KHC are worth watching.
We can use the Fundamental Explorer instrument to take a deep dive into their financials. Then, use the Valuation Wizard to generate a Price Target, and see the target on a chart using Technical Analysis. The workflow is now complete!
The Horizon Strategy

Horizon will significantly reduce equity exposure this week. The strategy will also slightly reduce treasury bonds exposure, and add to CASH holdings.
Equity exposure goes from 48% to 9%.
Bonds positioning will go from 41% to 32%.
Rebalance will only occur at the individual securities level, in order to bring each position at target weight (0.9% each).
The CASH position will increase from 11% to 59%.
This model has performed poorly as of late. It’s equity curve is more related to the Momentum Factor ETF than SPY. Momentum has lagged the broader market, but may be seeing a pick-up in relative performance, as discussed above.
As an aggressive equity exposure model, Horizon has got trapped in repeated “bear-market rallies”. Eventually, those will end sooner or later and this model will start performing closer to its historical metrics.
4. Market Environment
The next step in our process is to take into account the type of market environment that we are currently trading in. For these purposes we use the Market Internals and the Market Fundamentals Instruments. Comments on the overall state of the market can usually be found in our Weekly Preview Article.
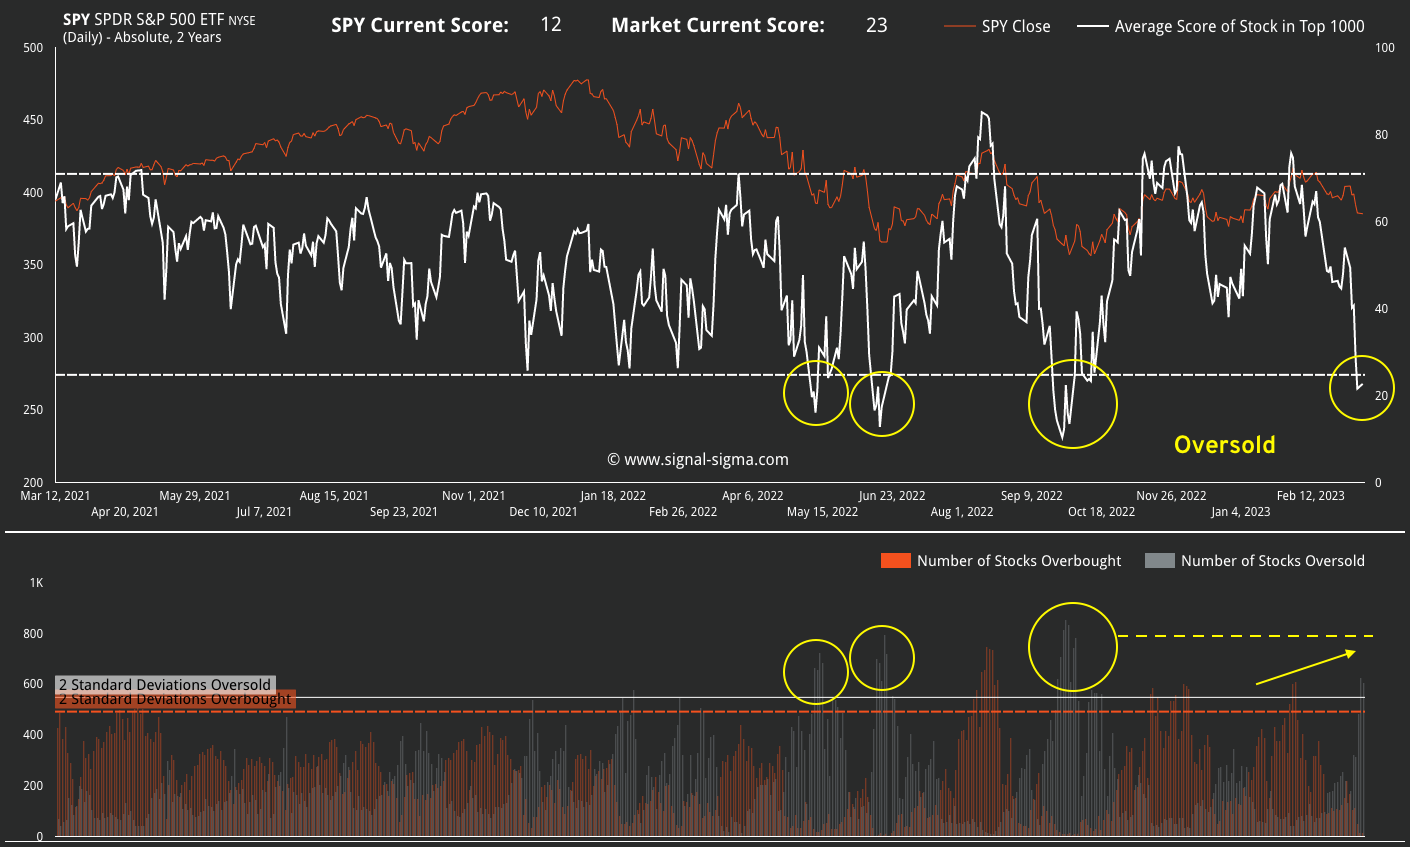
595 stocks. We’ve been watching that level since the correction began, and this week only 423 stocks are trading above their respective 200-DMA. The moving average support is breaking, and this is an ominous signal for the recovery.
From a Sigma Score perspective, SPY is trading slightly below the broad market average (-0.89 vs -0.78). The divergence could signal a slight bounce is in the cards for the index.
Cracks are showing in the resilience of the broad market. That dotted line represents the difference between “buy the dip” and “sell the rip”.
Bearish Signal in Stocks trading above their 200-day Moving Averages

We have reached an extreme in positioning. Our Overbought/Oversold indicator is now 2 Standard Deviations Oversold, similar with previous instances in 2022. However, we would like to point out there is sufficient room for the broad market to get more oversold, with the number of stocks Oversold having room to move higher. The market usually trades in this extreme fashion for at least 1 week before enacting a bounce.
This indicator is telling us to not sell in a panic at current prices.
In terms of Z-Score divergence, there is no notable difference this week. SPY is at -0.34, while the market is slightly above, at -0.22. The difference is not notable, with SPY and the market trading in line.
Neutral Signal in Market Internals Z-Score

Dollar Transaction Volume has increased on the latest selloff. This is no what we would like to see, as high volume “confirms” whatever price trend exists. If buyers and sellers are meeting at current (lower) prices, then there is scope for further downside, until volume settles lower as well (exhaustion).
Bearish signal in Average Dollar Transaction Volume and Volatility

5. Trading in the Sigma Portfolio
After reviewing all of the above factors, it’s time to decide on the actual investing strategy for our real-life portfolio.
Our models are aligned in terms of treasury market allocation. On the equity side, their suggestion is a reduction of risk, in favor of cash.
To start, we will take an average of CASH position sizing from all of our models. This will come down to 70%, with 57-59% allowed, if we are feeling more like taking on risk. Equity allocation does not exceed 9% even on Horizon., the most aggressive model.


We need to look for an opportunity to reduce equity risk in the portfolio (preferably via hedging, since our long positions are well researched). What we don’t want to be doing is to panic-sell in an oversold market. We are eyeing a bounce that does not clear SPY $395 for this trade.
Our 45%, bonds positioning is at target.
We will keep you apprised of our trading in the Sigma Portfolio.
Andrei Sota