Portfolio Rebalance / March 21
Following the Signal Sigma Process
Tuesday is the day when all of our strategies rebalance their asset class holding weights. The approach to this article follows the step by step process described here.
Prefacing this article, I would like to remind our readers that our systems are primarily geared toward medium-term trend-following. In order to generate out-performance, a clear, sustained trend must emerge, so that our strategies will “latch on” and ride on that trend until its conclusion. What we have witnessed over the past 2 years is an undecided market for most asset classes. SPY is trading broadly at the same level of 2 years ago. Gold has been vacillating on both sides of a flat trend. Commodities have had a nice run-up, that has unravelled since June of last year.
This kind of macro environment is doing our strategies no favors. The only asset class that have shown a clear trend have been Treasuries, whose bear market appears to be at an end.
Asset Class Allocation
The first step in determining optimal portfolio positioning is taking a look at the performance of the main asset classes, and determining which are suitable for investment. The Asset Class Overview Instrument gives us a clear macro picture.
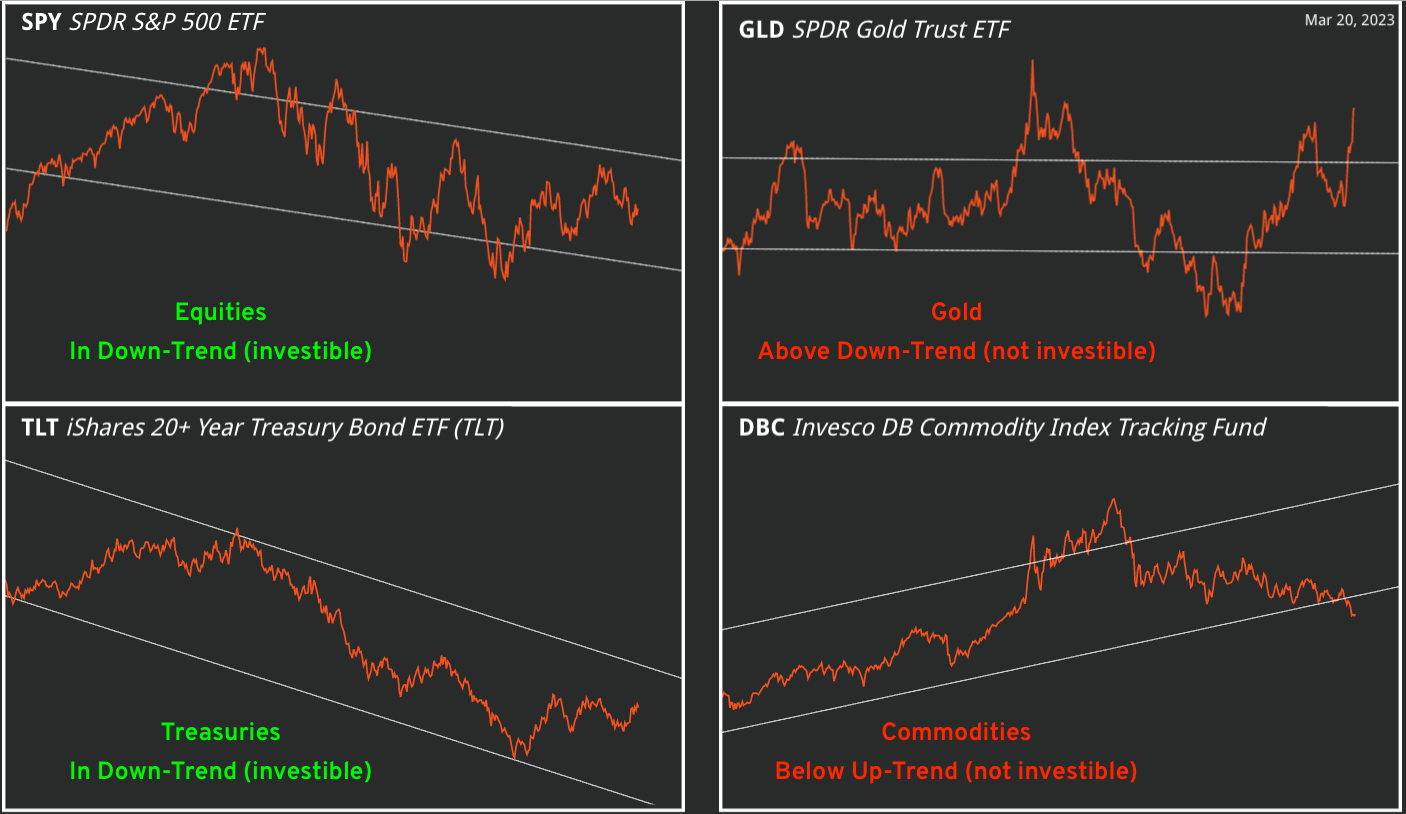
Equities have held up well during the recent selling pressure and continue to be investible, despite the volatility; Gold is extremely overbought and historically deviated to the upside; Treasuries have also experienced increased realized and implied volatility and continue to be investible for now; Commodities have suffered under the threat of a potential recession and have fallen below their trend channel, making them un-investible.
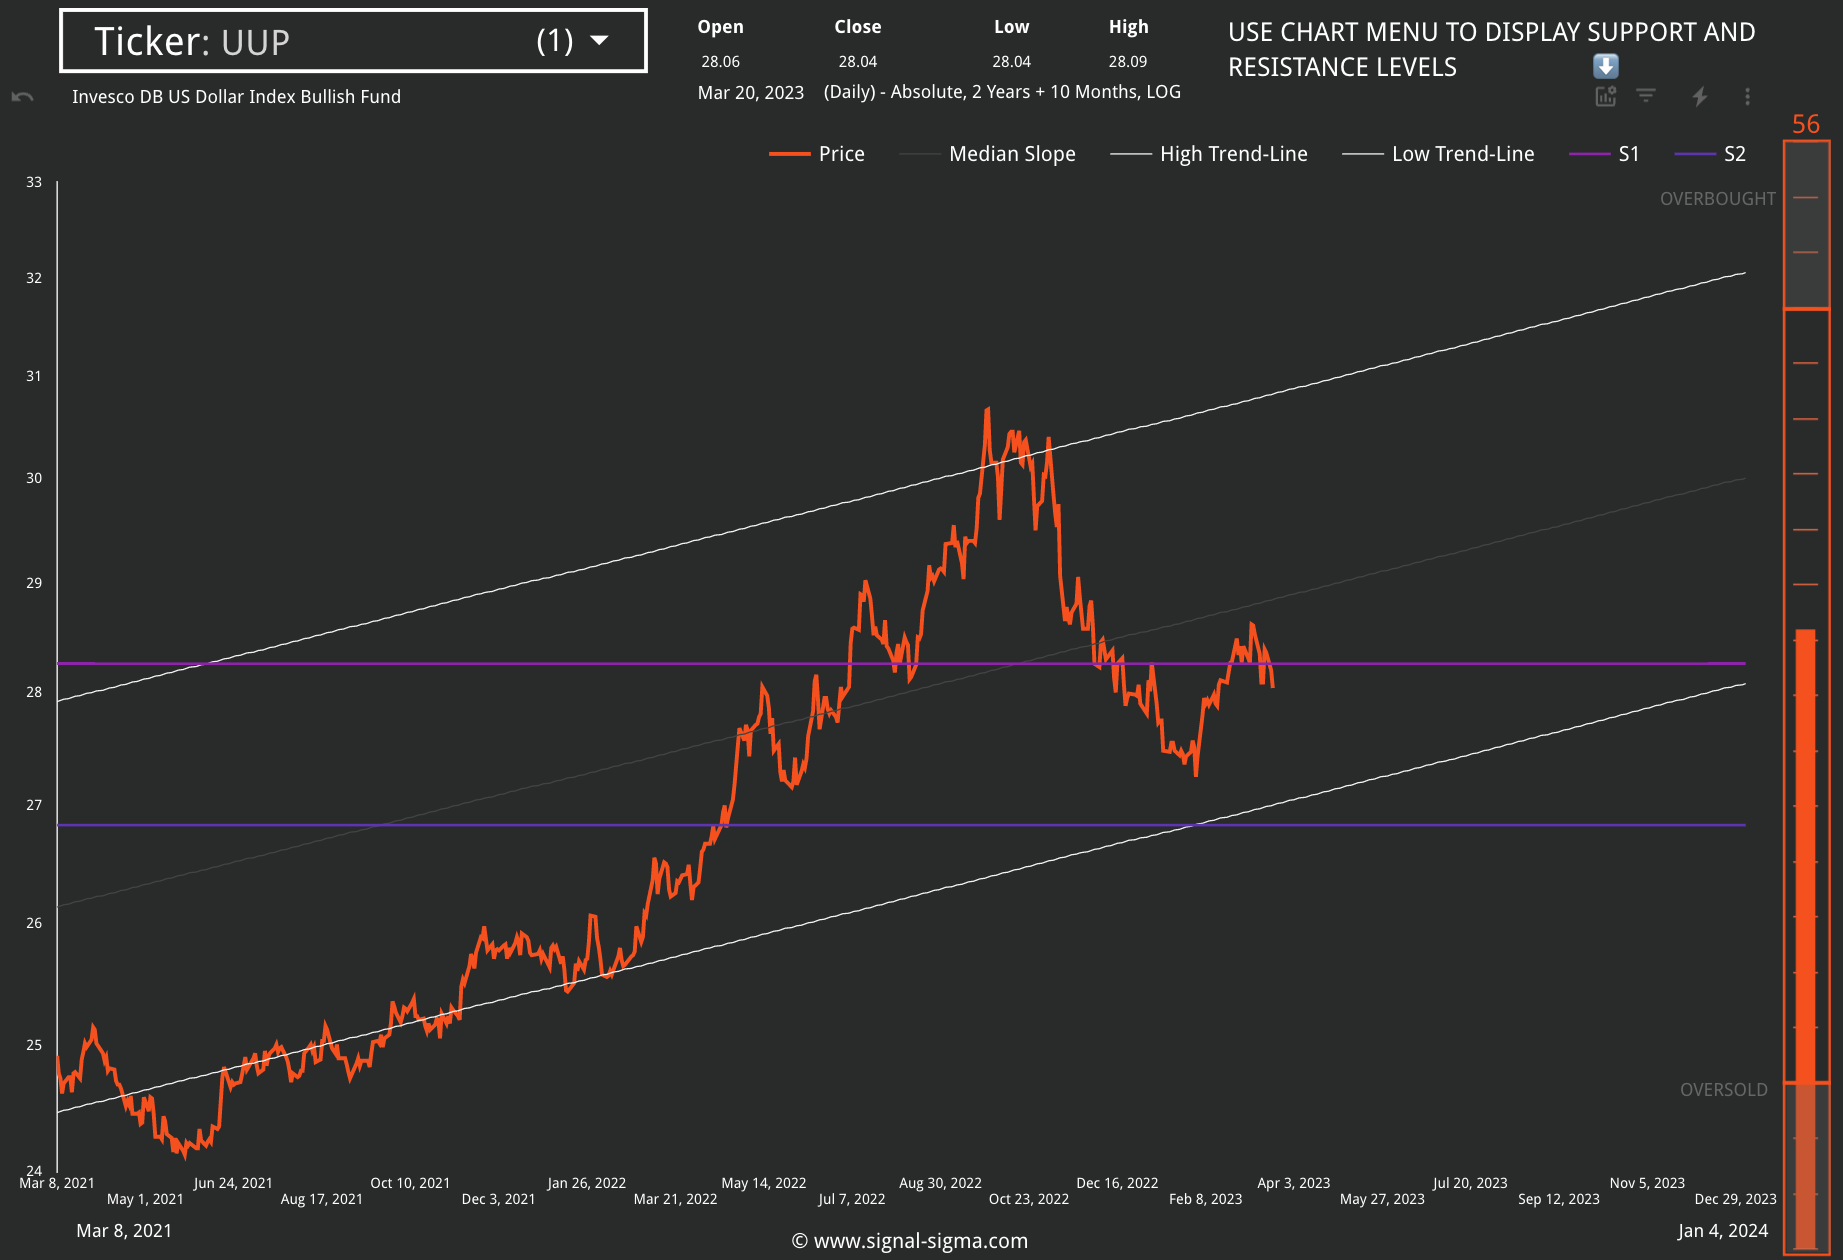
The US Dollar has struggled to hold the key S1 level, and its strength looks to have waned. If the current trend reverses completely, then we expect the USD to settle near the lower Trend-Line and the S2 Level (currently at $26.83).
We are constantly checking for a break in the current negative correlation regime between the US Dollar (white) and every other asset class, combined (orange). There is no meaningful such break as of yet, and the divergence we have noticed in the last couple of weeks has subsided.
Conclusion: it is still an environment where the Dollar is trading against “everything else”, symptomatic of a bear market.


The relative chart of SPY / TLT shows that treasuries have reached the historical lower bound, where performance usually reverts in favor of equities.
The Enterprise Strategy
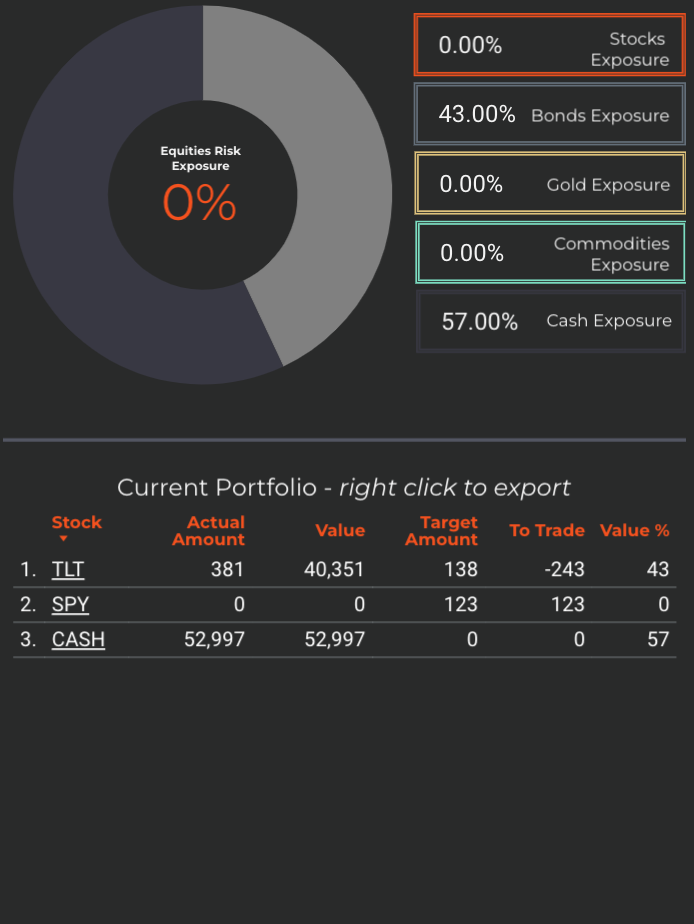
Enterprise, our most conservative model, is entering the week 43% long Treasuries, and 57% CASH.
Since this model only trades 4 asset class ETFs, we use it to judge overall portfolio positioning.
Equities are targeted for exposure at 52% of portfolio value (up from 8% last week), via SPY ETF. The position will be filled only if SPY manages to close above the M-Trend level of $394, and a BUY signal then occurs.
The model’s treasury allocation is overweight for the time being, and is meant to be reduced on the next available SELL signal (from 43% currently to 27%).
At 57% Cash is still the dominant position for this model.
2. Sector / Industry Selection
The next step in creating our portfolio positioning is to break down each broad asset class into more granular groups of assets. This will help us understand which pocket of the market is outperforming or underperforming and make our selection accordingly.
Since Equities are an investible asset class, we’ll take a look at how different Factors are performing and check for any notable opportunities.


We have included tables for this week and prior 2 weeks in order to help you compare developments (click on the arrows or thumbnails to cycle through the tables). You will notice how conditions go from Overbought (2 weeks ago) to “under pressure” (1 week ago), and finally we get to the “rebound” setup we are seeing today.
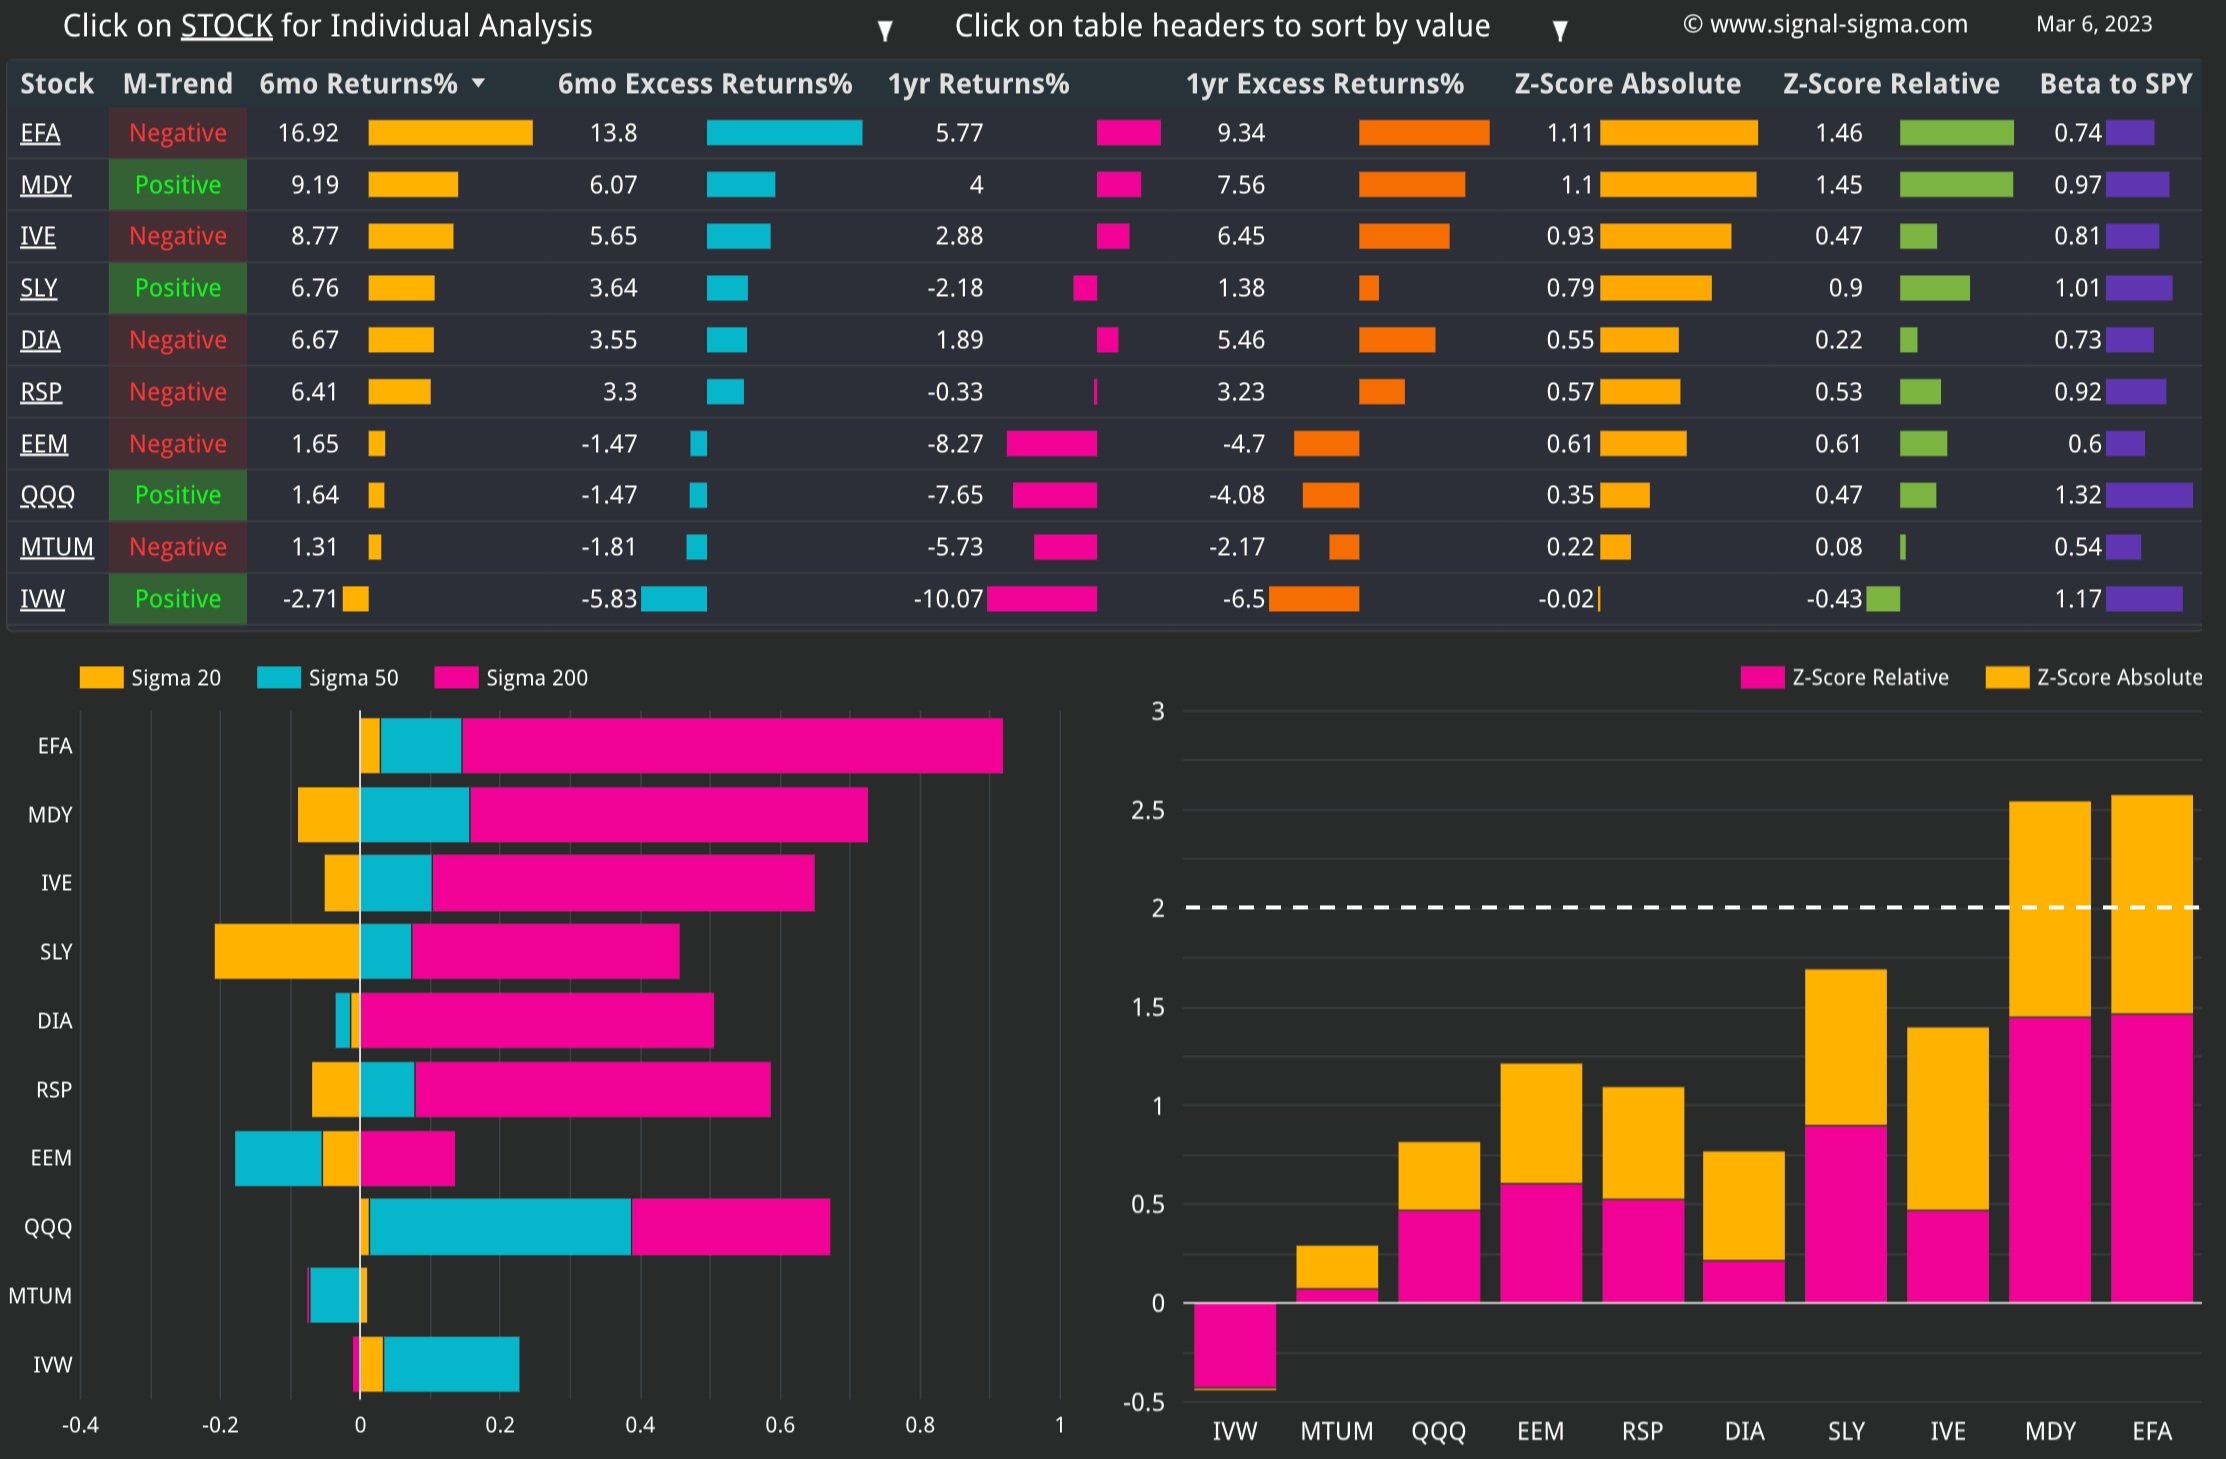
QQQ (Nasdaq) and EFA (Developed Foreign Markets) are sitting at the top of the Z-Score table comfortably and arguably overbought, while the “middle of the market” comprised of MDY (Mid-Caps), RSP (Equally Weighted SPY), SLY (Small Caps) are trading below all key moving averages and slightly under-performing SPY. This is a natural predicament given the fact that smaller companies are more vulnerable to a more severe economic shock.
By using our proven selection criteria (Z-Relative > 0, while Sigma 50 < 0), the following factors would make good investment candidates for a technical play:
The rest of the factors seem to be in a transition process, where the market is still digesting the impact of rate hikes and potential economic fallout from the banking sector crisis.
Charts Emphasis:
The Momentum Factor (MTUM) is still lagging the broad market, but it seems to now have stabilized near previous lows. Mid-Caps have continued the correction, breaking the promising relative performance trend. QQQ (Nasdaq) has reached relative performance levels more commonly associated with reversions in relative performance.


Here’s how we stand on the Sectors front:


Like in the factors category, we have included the last 2 weeks of tables as well.
The financial sector (XLF) remains under pressure despite the recent rebound. Energy has broken down to the limit of its technical channel and is now extremely oversold (a bounce would not surprise), and similar to QQQ, XLK (Tech) is out-performing to some extreme extent.
In another notable observation, Energy is the only sector with a positive 1-year performance (2.06%).
By using our proven selection criteria (Z-Relative > 0, while Sigma 50 < 0), the following sectors would make good investment candidates for a technical play:
XLI (Industrials)
Defensives (like Healthcare - XLV) are barely holding on to their longer term relative out-performance trend, Industrials (XLI) are getting a respite from Overbought levels, and Tech (XLK) is off the charts when compared to SPY. A rotation from XLK to more defensive sectors would surely make sense at this juncture.


Taking all of these into account, Nostromo will select the out-performing factors for allocation: EFA and EEM, along with a contingent of treasuries.
On the treasuries side, MBB is slated for reduction, while TLT is preferred for exposure instead.
The Nostromo Strategy

Nostromo, our tactical allocation model, has been trading in and out of a small MDY position, without much effect.
The model is aiming to build its equity position, using EFA and EEM ETFs up to 52% of overall portfolio value.
The EEM position will get added to on the next BUY signal, while EFA will be initiated also when a signal triggers.
On the treasuries side, Nostromo plans to allocate towards TLT on the next BUY signal. If the opportunity presents itself , it shall sell MBB.
For more info about how Nostromo targets sectors or factors within a broader asset class, read this article. The first part sheds some light on the selection process going on in the background.
3. Individual Stock Selection
This week, we would like to screen for momentum and quality companies, just in case we need to re-allocate to risk on a rebound rally. We’ll use the Momentum + Quality Screener with the following rules:
Piotroski F Score => 6; this ensures Quality
6 month & 1 Year Absolute Returns > 0; a basic momentum requirement
Sharpe Ratio > 1; very favorable risk-reward
Z-Relative > 0; stock outperforms its benchmark ETF
MACD Trend is Positive; medium term momentum is trending up
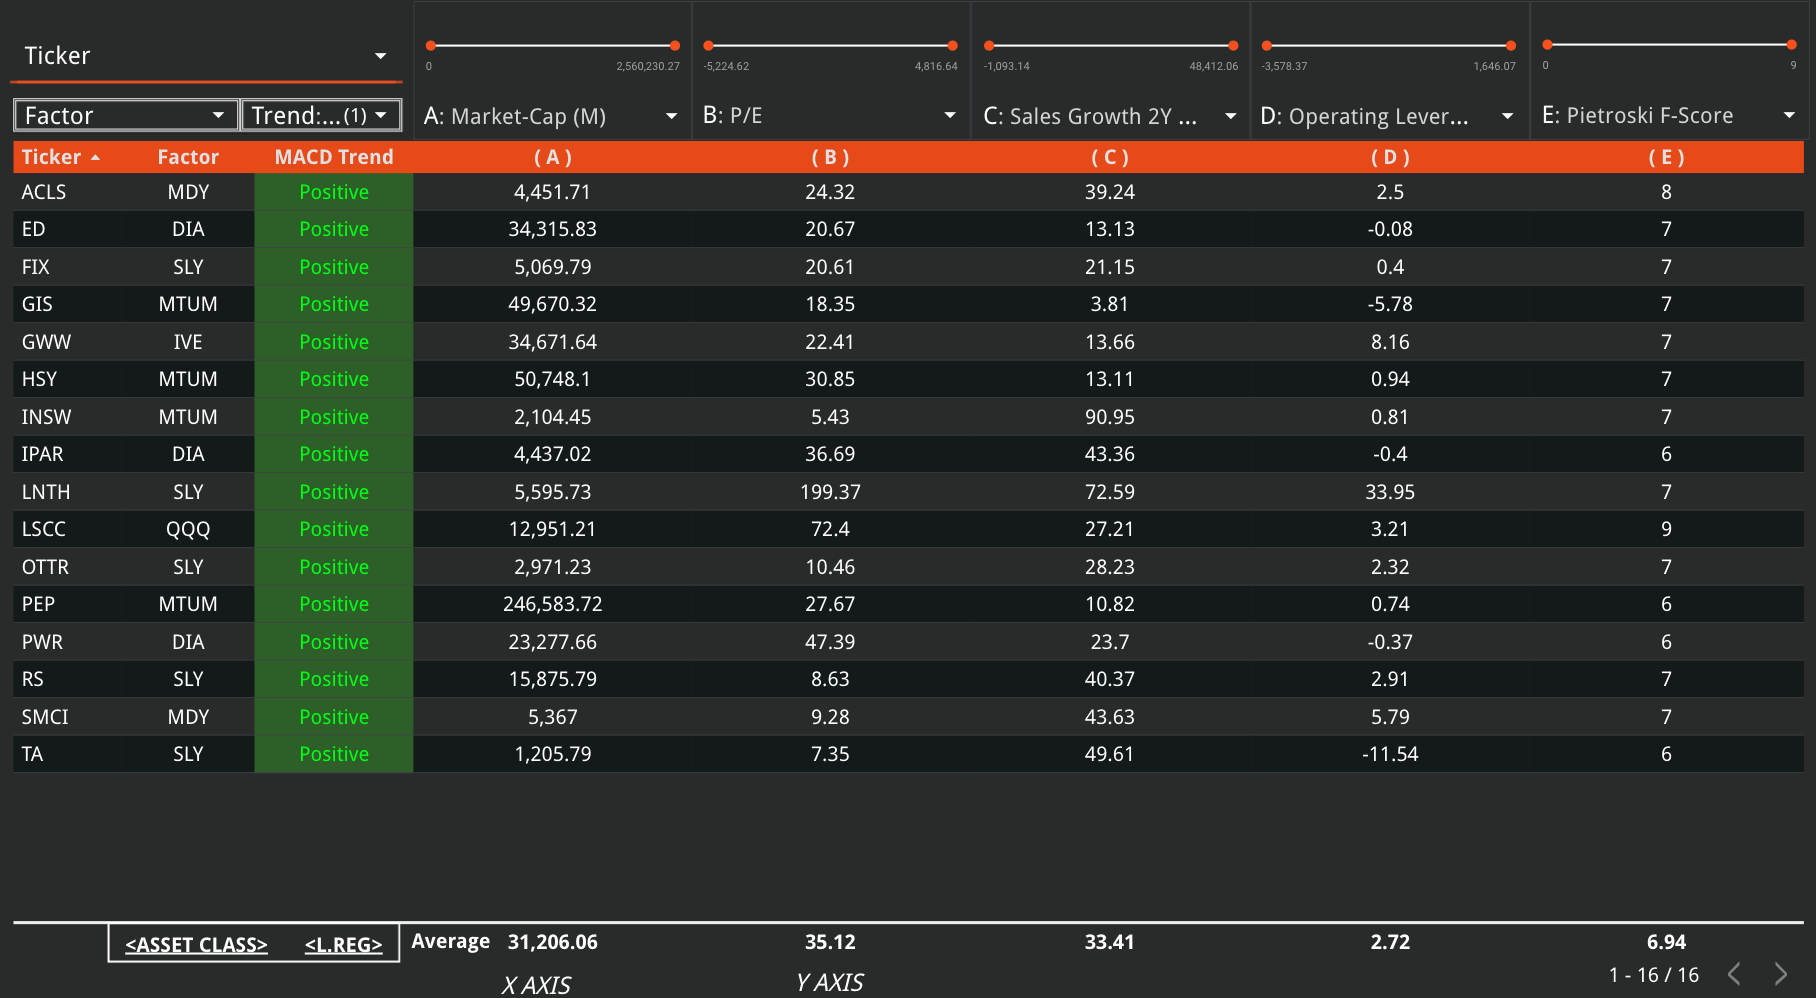
ACLS, GWW, FIX stand out to us from the screener output.
We can use the Fundamental Explorer instrument to take a deep dive into their financials. Then, use the Valuation Wizard to generate a Price Target, and see the target on a chart using Technical Analysis. If interesting, we will look for opportunities to add them to our portfolio.
The Horizon Strategy

Horizon is rebalancing its equity portfolio this week. Overall allocation to stocks will increase to 52% from 9% last week.
Bonds positioning will stay at 32%, the same as last week.
The CASH position will decrease from 59% to 16%.
At the individual stocks level, these positions will be CLOSED:
XOM (Exxon Mobile)
NVT (nVent Electric PLC)
WFRD (Weatherford International PLC)
SLB (Schlumberger NV)
These positions will be newly initiated:
JBL (Jabil Circuit Inc)
OI (OI Glass Inc)
LSCC (Lattice Semiconductor Corp)
IPAR (Inter Parfums Inc)
The other positions will be rebalanced at 5.2% portfolio weight.
This model has performed poorly as of late. It’s equity curve is more related to the Momentum Factor ETF than SPY. Momentum has lagged the broader market, and has reached previous-low levels.
As an aggressive equity exposure model, Horizon has got trapped in repeated “bear-market rallies”. Eventually, those will end sooner or later and this model will start performing closer to its historical metrics.
4. Market Environment
The next step in our process is to take into account the type of market environment that we are currently trading in. For these purposes we use the Market Internals and the Market Fundamentals Instruments. Comments on the overall state of the market can usually be found in our Weekly Preview Article.
Again, the market finds itself in a make-or-break type of moment. Breath has been weakening lately, with the number of stocks trading below their 200-DMAs testing a key level. Notably, the SPY is starting to diverge from the market in a bearish way. SPY’s sigma score of -0.17 is significantly higher than the average stock (-0.55).
This set-up can still go both ways, but the divergence that we see now is troubling short term.
Bearish Signal in Stocks trading above their 200-day Moving Averages

The market is still fairly oversold, but no longer in “panic” mode. As a contrarian indicator, this instrument is flashing a BUY when reaching extremes. A “real” extreme is yet to show up, however, as there is a possibility it can go much lower than at present.

In terms of Z-Score divergence, there is a bearish divergence forming here as well. SPY is trading near Z-Score 0, while the average stock is registering -0.15. While not large, this gap shows that the average stock has fared worse than the SPY in the current correction. This is the marker of a “confirmed” correction process.
Neutral / Bearish Signal in Market Internals Z-Score

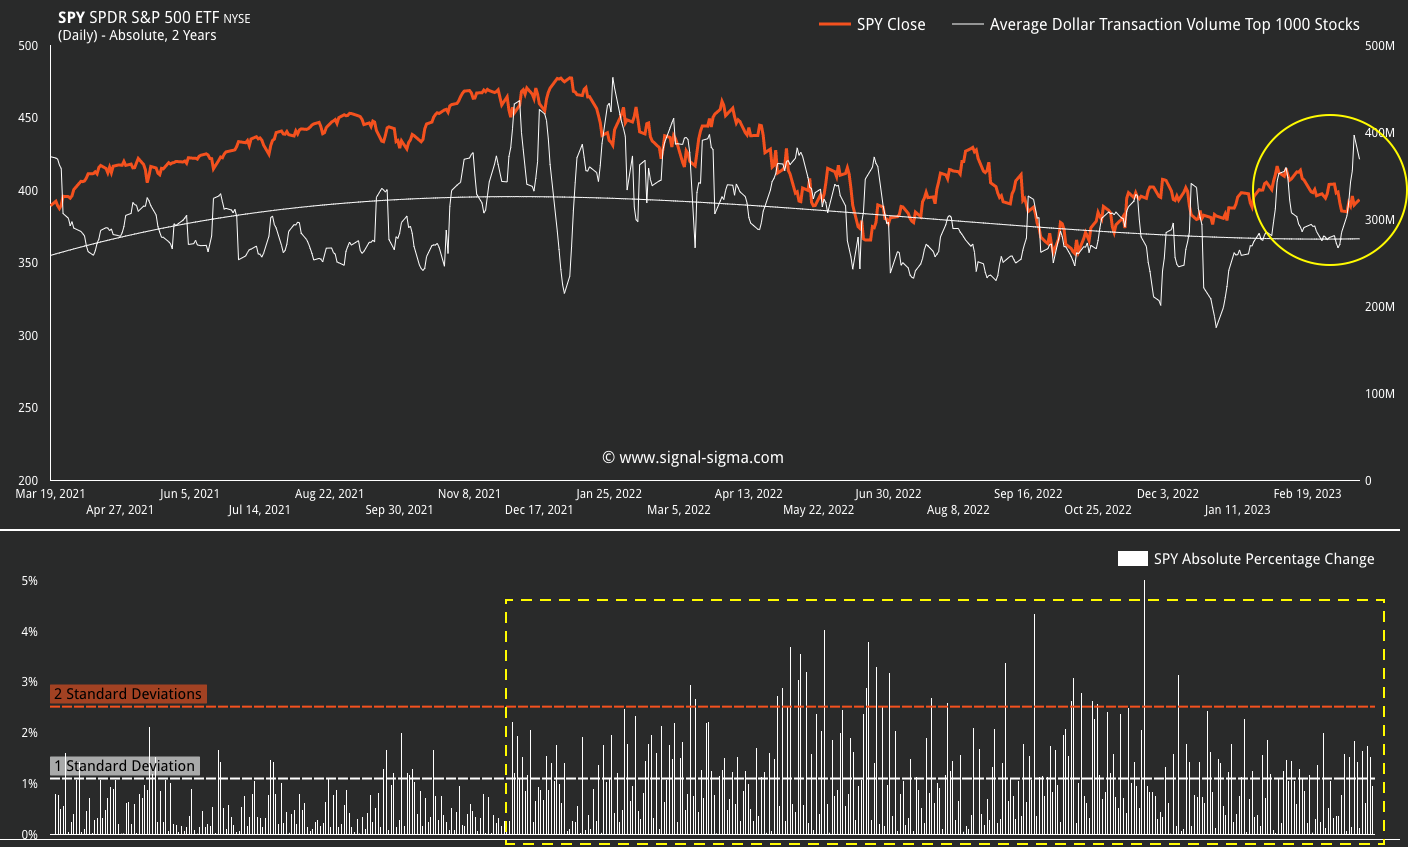
Dollar Transaction Volume has surged on the recent price action. Associated with a fall in stock prices, increased volume is not a positive development. While the good news is that overall liquidity has improved in the market, one could argue that it is the only thing keeping equities afloat. Volatility has remained elevated, with SPY constantly notching daily moves above 1 Standard Deviations (1.1%).
We would like to see a “low” in volume being reached, in order to call the current market move “over”.
Neutral signal in Average Dollar Transaction Volume and Volatility
5. Trading in the Sigma Portfolio
After reviewing all of the above factors, it’s time to decide on the actual investing strategy for our real-life portfolio.
Our models are aligned in terms of treasury market allocation. On the equity side, they are eyeing an increase of risk, depending on SPY’s behavior during the next couple of weeks.
To start, we will take an average of CASH position sizing from all of our models. This will come down to 55%, with 94-16% allowed. Equity exposure stands at 18% on average, while on the treasury side models average 26%. The average allocation makes a lot of sense at the moment, and we would target it in our model.


Depending on today’s close, we may or may not close our hedge position in the Sigma Portfolio. In order to close the hedge, we need to clearly have SPY close above its M-Trend level, at 394. In such a case, we will increase our equity exposure to 18%.
Our 45%, bonds positioning is above target currently, and we plan to follow Enterprise in bringing this down when a signal triggers.
We will keep you apprised of our trading in the Sigma Portfolio.
Andrei Sota