Portfolio Rebalance / November 08
Following the Signal Sigma Process
Tuesday is the day when all of our strategies rebalance their asset class holding weights. We will take a new approach to this article format, better following the step by step process described here.
Asset Class Allocation
The first step in determining optimal portfolio positioning is taking a look at the performance of the main asset classes, and determining which are suitable for investment. The Asset Class Overview Instrument gives us a clear macro picture.

According to our methodology, the only asset class to qualify for investment are commodities, which are trading within the regular risk-reward channel. All of the other asset classes are currently trading below trend and will be excluded from allocation on that basis.
The all-important US Dollar is trading sideways as of late with its rally apparently running out of steam. It is holding important support at 29.75 currently.

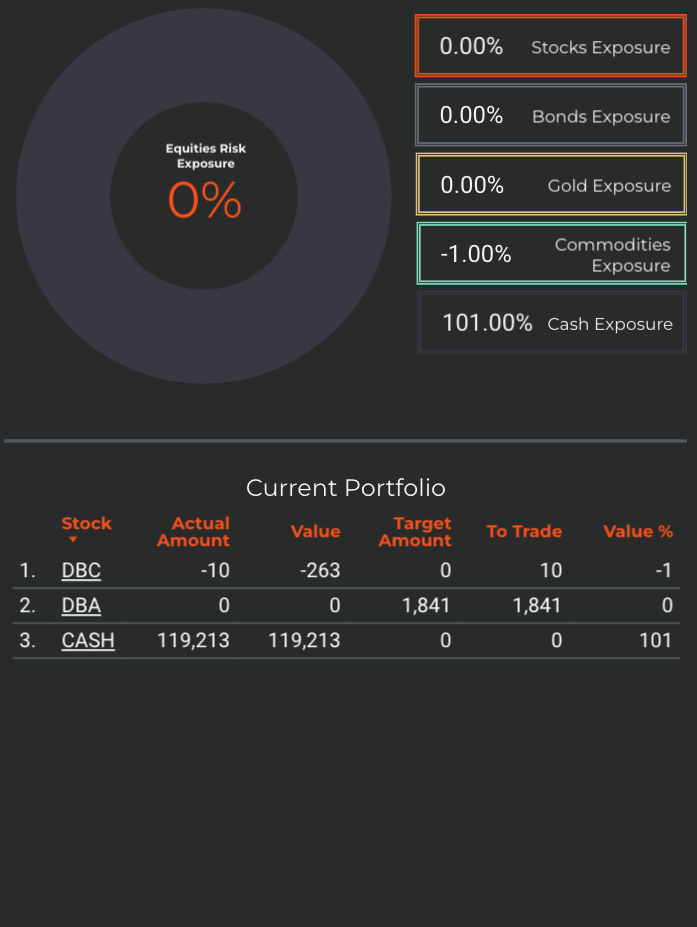
The Enterprise Strategy

Enterprise, our most conservative model, holds 52% exposure to commodities, and 48% cash.
Since this model only trades 4 asset class ETFs, we use it to judge overall portfolio positioning.
The strategy will aim to decrease exposure to commodities on the next available SELL signal. The decrease will be significant, almost halving the current position after the rally.
The logic behind the trade was that commodities should benefit from a lower US Dollar. As it turned out, they did benefit massively, with Enterprise registering a massive performance spike as of late.
Cash reserves (USD) are at 48%, offering plenty of optionality.
2. Sector / Industry Selection
The next step in creating our portfolio positioning is to break down each broad asset class into more granular groups of assets. This will help us understand which pocket of the market is outperforming or underperforming and make our selection accordingly.
For equities, we normally use either the Sectors Overview or the Factors Overview Instruments. However, this week (and indeed it has been the case for a while now), equities have not been part of our asset class allocation. In order to produce the relevant statistics, we will need to dig a bit deeper into the algorithm’s “mind” and pull out some excel sheets.

Commodities are broken down into several other more granular ETFs. The first way we screen for outperformance is by looking at the Z-Relative column. Simply put, Z-Relative measures relative outperformance of each instrument versus its benchmark (in this case, the benchmark is DBC). We find several out-performers:
XME
BAR
DBA
The next step is determining where the opportunity to trade lies in the medium term. We look at the Sigma 50 column and find Negative values (in order to “buy the dip in what is otherwise a relative out-performer). The ETF that fits both criteria (positive Z-Relative AND negative Sigma 50) is DBA, the ETF for agricultural commodities. It will serve as the only position that Nostromo will target for allocation.
For your information, the only Sector or Factor that would meet the same screening criteria is XLU (Utilities ETF).
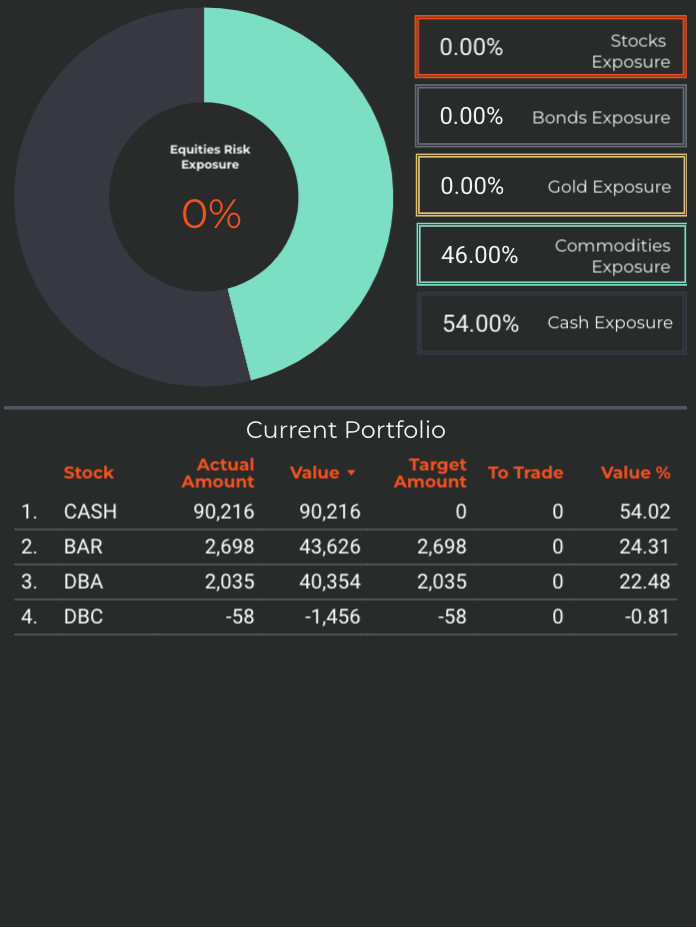
The Nostromo Strategy
Nostromo, our tactical allocation model is starting the week with 100 % cash positioning.
The strategy will look to buy DBA (agricultural commodities) on the next available BUY signal.
This is unlikely to occur in the following trading week, as the ETF has triggered such a BUY signal while simultaneously below the trend that would act as a Stop-Loss; this has resulted in the strategy not doing anything with the position.
For more info about how Nostromo targets sectors or factors within a broader asset class, read this article. The first part sheds some light on the selection process going on in the background.
3. Individual Stock Selection
If we would like to break down the Asset Class Allocation into specific equities rather than ETFs, we would employ the Stock Screener Instrument. However, since equities are not part of our “official” asset allocation, we need to get a bit creative with the screener in order to come up with relevant results.
The basic screening process in the type of down market we are experiencing would revolve around relative outperformance (stocks that are STILL holding up well), while maintaining correlation to our asset class of interest.
Start by selecting the following options from the Main Menu: Fundamentals Explorer > Asset Class ETFs > Weekly MACD.
Then, select DBC from the Asset Class selection box (below the Ticker). This will only show stocks correlated to the commodities ETF. Set Piotroski F-score to minimum 6, so we get a screen of quality companies. Next up, set Operating Leverage to 1 so we screen for a fundamentally solid business model.
We’ll set column A to Z-Score Relative, and set this to minimum of 0, so we’ll only screen for outperforming companies.
We’ll set column B to Sharpe Ratio and set this to minimum 0.75, so a stock should show a good risk-reward profile.
We’ll set column C to 6mo Excess Returns and sort by this column. Now we have a basic Asset Class + Quality + Momentum screen, and can further research these stocks if interested.

Horizon Strategy
Unfortunately, the Horizon Strategy was not able to correctly run today. We are working to resolve the issue with our data provider and hope to fix this soon.
Horizon has not rebalanced its holdings.
4. Market Environment
The next step in our process is to take into account the type of market environment that we are currently trading in. For these purposes we use the Market Internals and the Market Fundamentals Instruments. Comments on the overall state of the market can usually be found in our Weekly Preview Article.
Overall, we find that conditions are neutral to slightly negative for all of our asset classes. It is still a question of the US Dollar against everyone else. We are cautious on taking on excess risk exposure at the moment. Short term risk-reward is neutral.
5. Trading in the Sigma Portfolio
After reviewing all of the above factors, it’s time to decide on the actual investing strategy for our real-life portfolio.
First of all, we will take an average of CASH position sizing from all of our models. This will come down to roughly 66%, with a minimum and maximum of 48% and 100% respectively.


Using a defensive Market Environment view, we can safely allocate 0% - 33% to something other than CASH.
In the Sigma Portfolio, we are missing the significant exposure to commodities that our systems have selected. I will concede that this is a mistake on my part, for ignoring the glaring BUY signal from October 27. We are now in a position to play catch up on this trade, so we will look to fill a part of the position on the next rebalance opportunity.
The net-long portfolio has the following correlation signature: XLE, XLI, XLB / MTUM / SPY, DBC

Hedging is done via SH (short SPY, 11%) and PSQ (short Nasdaq, 5%). The portfolio is slightly net-short, at 13% long vs 16% short.
The intention is to tilt even more net short on a rise in equities to resistance levels that are not breached. This thesis could be denied on a soft inflation print on Thursday and SPY rising above the 385-391 area which currently acts as the “pivot”.
Andrei Sota