Weekly Preview / November 14
Notable Events on our Weekly Watchlist:
Monday: Consumer Inflation Expectations
Earnings: TSN
Tuesday: PPI
Earnings: HD, WMT, ARMK, AAP,
Wednesday: UK Inflation, Retail Sales
Earnings: CSCO, LOW, NVDA, SONO, WSM
Thursday: Continuing Claims, Housing Starts
Earnings: BABA, AMAT, FTCH, KSS, M, ROST
Friday:
Earnings: FL, JD
ETFs to watch: SPY, XLY, QQQ, TLT
Bulls charge after softer inflation print - where does that leave us now?
Last week the market was trading in a compressed range and bound to explode in either direction. With most algorithmic strategies “parked” at a neutral state, we isolated the following levels (SPY was trading at $376 then):
Upside Target - 407
Upside Pivot - 385
Downside Pivot - 372
Downside Target - 352
Thursday bought about a softer inflation print than expected (7.7% actual vs 8% expected), and the market immediately cleared the Upside Pivot. This prompted several trading models to buy, and as SPY breached 390, virtually ALL algorithms became forced buyers. As Friday came to a close, another liquidation effect took place, this time for the bears - they simply had to close out remaining hedges or face the possibility of even higher technical upside and losses on their books. It was a buy-to-cover for the ages, a 3-Sigma one-day event!
The resulting price action left SPY up 5.59% on the week, with long duration treasuries also marking significant gains (+3.34%). I would argue that going forward, it’s the price action of bonds that requires more observation rather than stocks. Along with long duration bonds, several unprofitable tech stocks (which happen to be heavily shorted) also rallied more than 20%.
Is a new bull market upon us, or is this just another bear market rally? Let’s start by breaking down the price action in SPY:
SPY Analysis
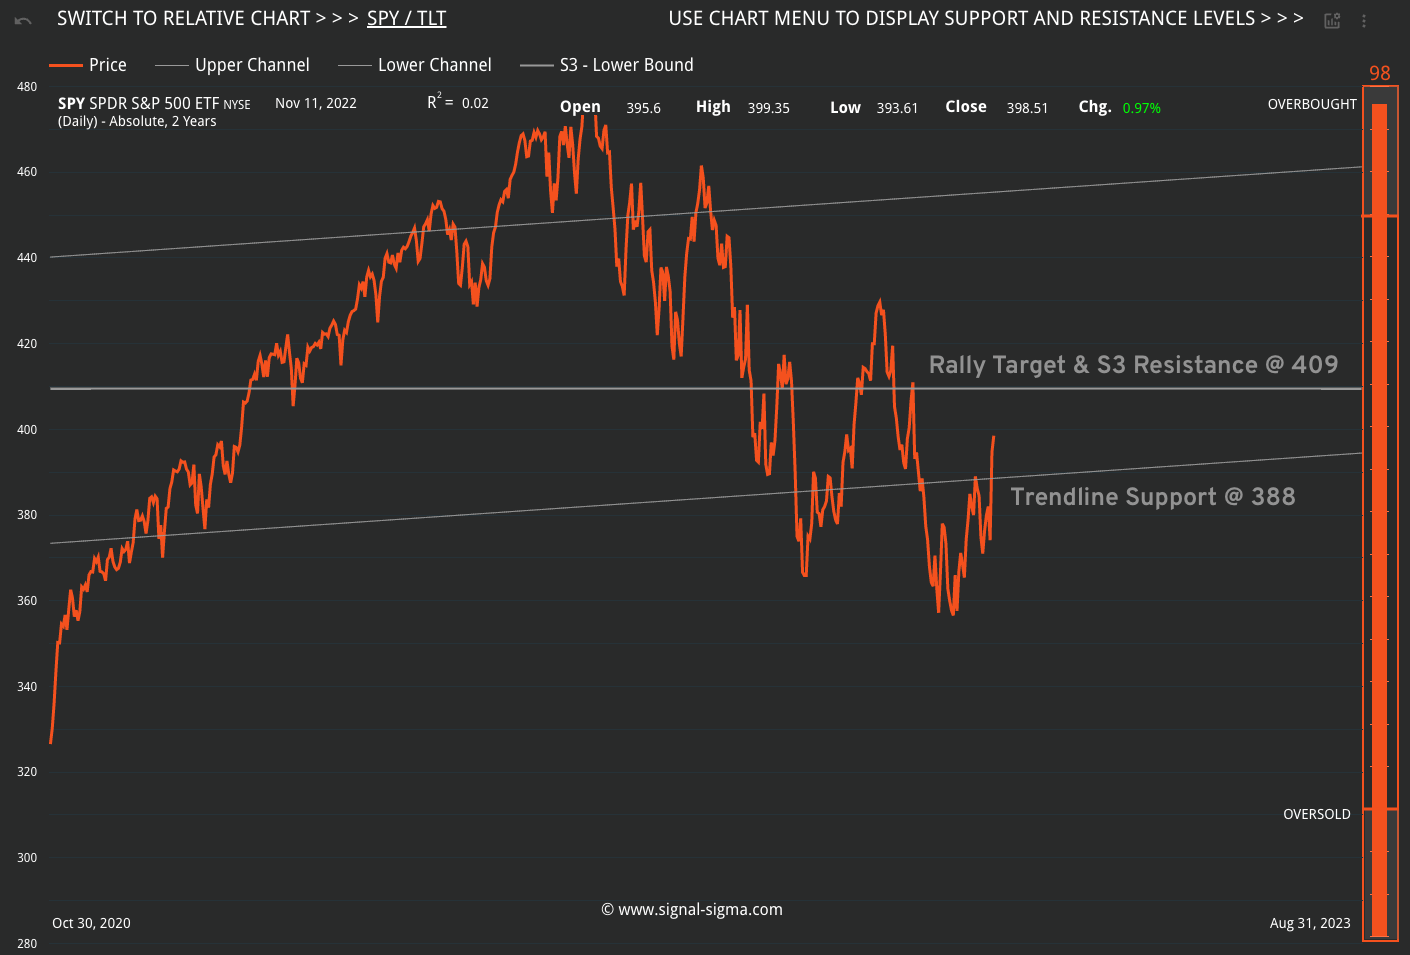
SPY is trading in extreme overbought territory (98/100 on our indicator, right), with the MACD BUY signal still intact. Our methodology identifies resistance at $409, a level which closely coincides with the 200-day Moving average at $406. Support sits at the base of the trading channel, at $388.
We expect a continuation of the rally to our designated target, with maybe a couple of days of consolidation in-between. At current levels, the Horizon Strategy will initiate a position in equities (more on that tomorrow).
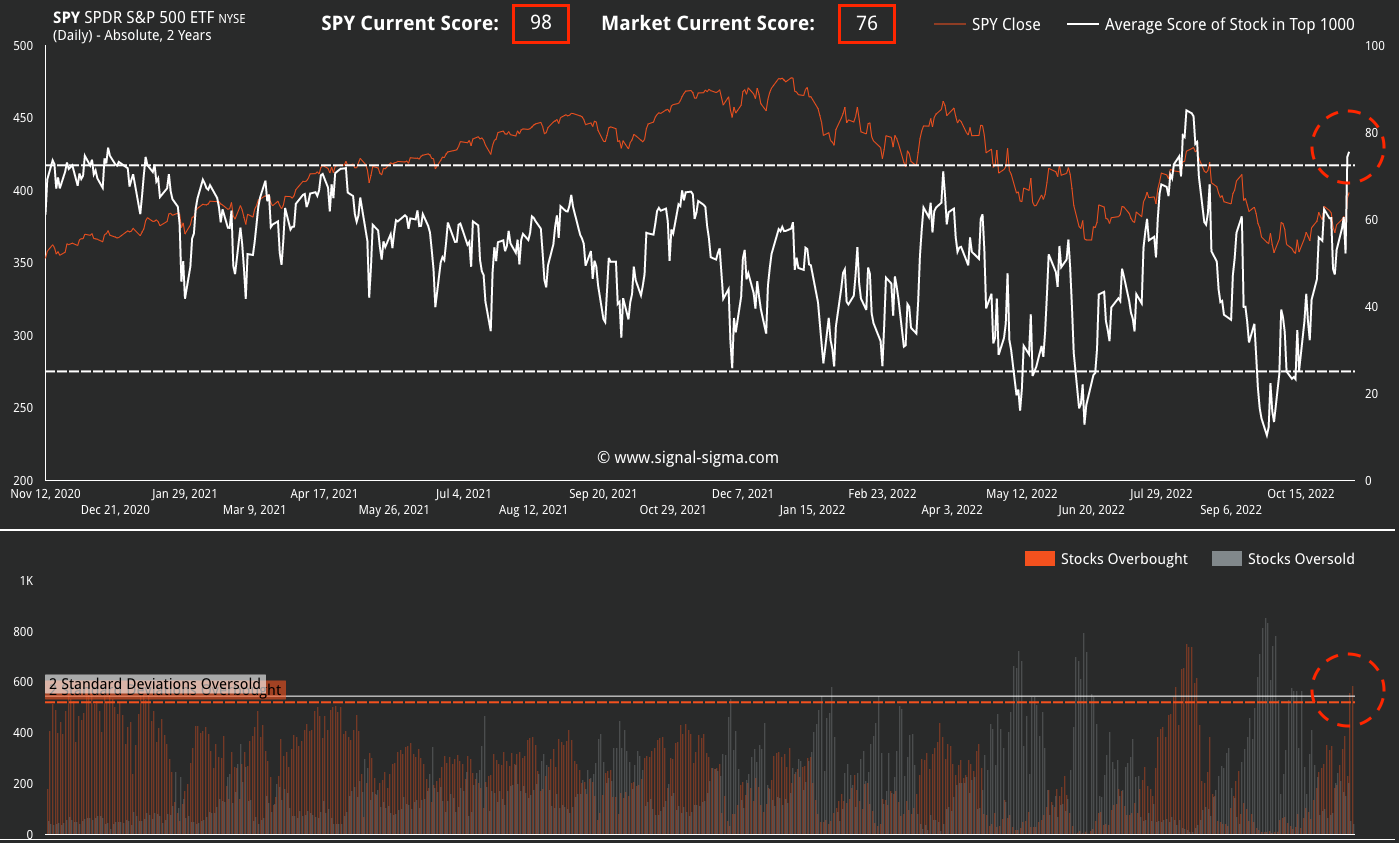
Let’s examine the breadth of the market, by following one of our most useful instruments: the Market Internals.
By this metric, we are dealing with a rally that has extended to levels that have previously been excellent places to reduce exposure. Market breadth is now 2 standard deviations overbought, on both metrics (average reading - upper panel and number of shares - lower panel).
Note the fact that the 2-Stdev Oversold line is still higher than the 2-Stdev Overbought line, a significant difference to the August rally.
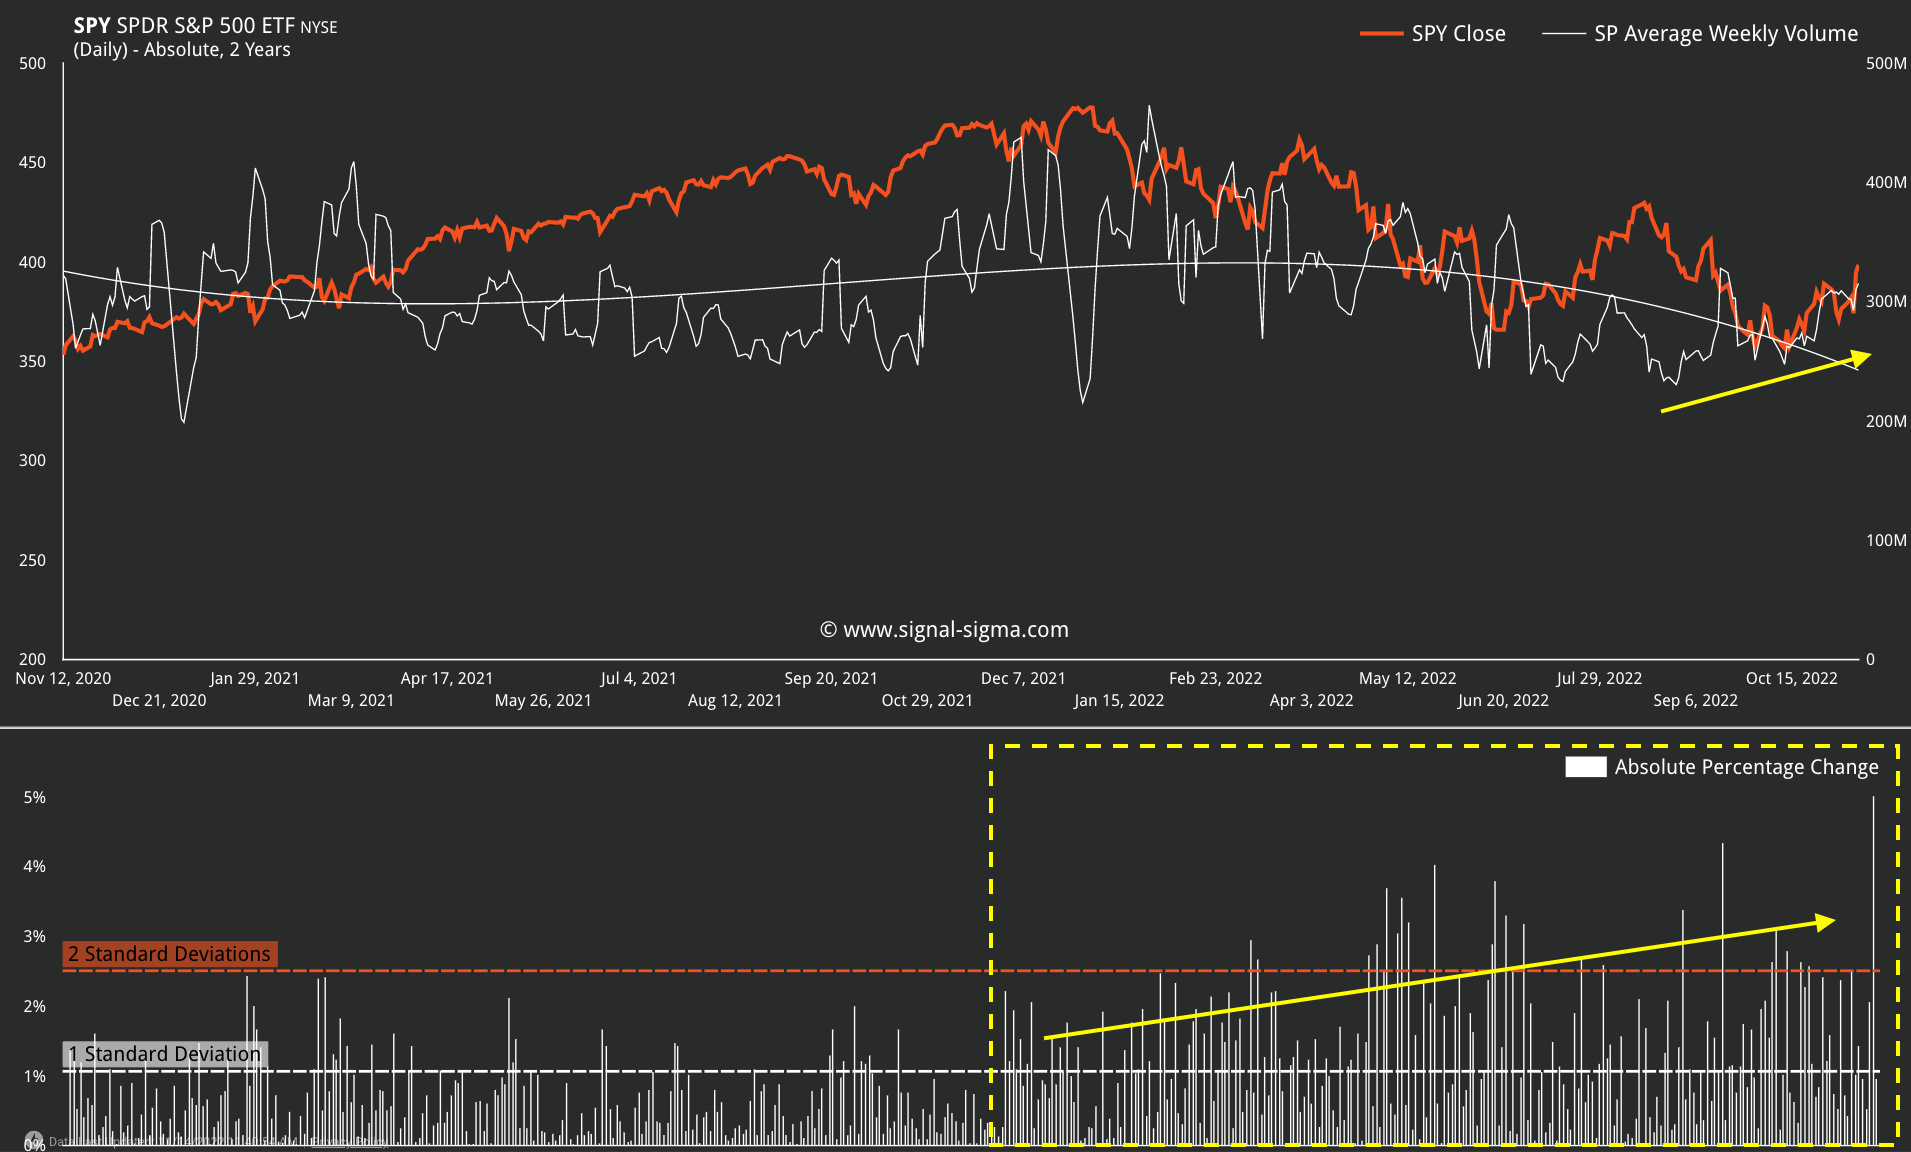
On the volume side of the equation, we are seeing rising transaction dollar volumes accompany this rally (which is good news for bulls, since it shows that not only short covering has occurred post inflation print, but also new long positions have been initiated). However, the huge percentage change associated with the move is NOT a good sign, since it perpetuates the high volatility regime we have been facing since November 2021.
On a side note, 5% up days for SPY happen mostly during bear markets. During bull markets, such moves are uncommon, as stocks usually grind higher over the course of multiple years.
TLT Analysis
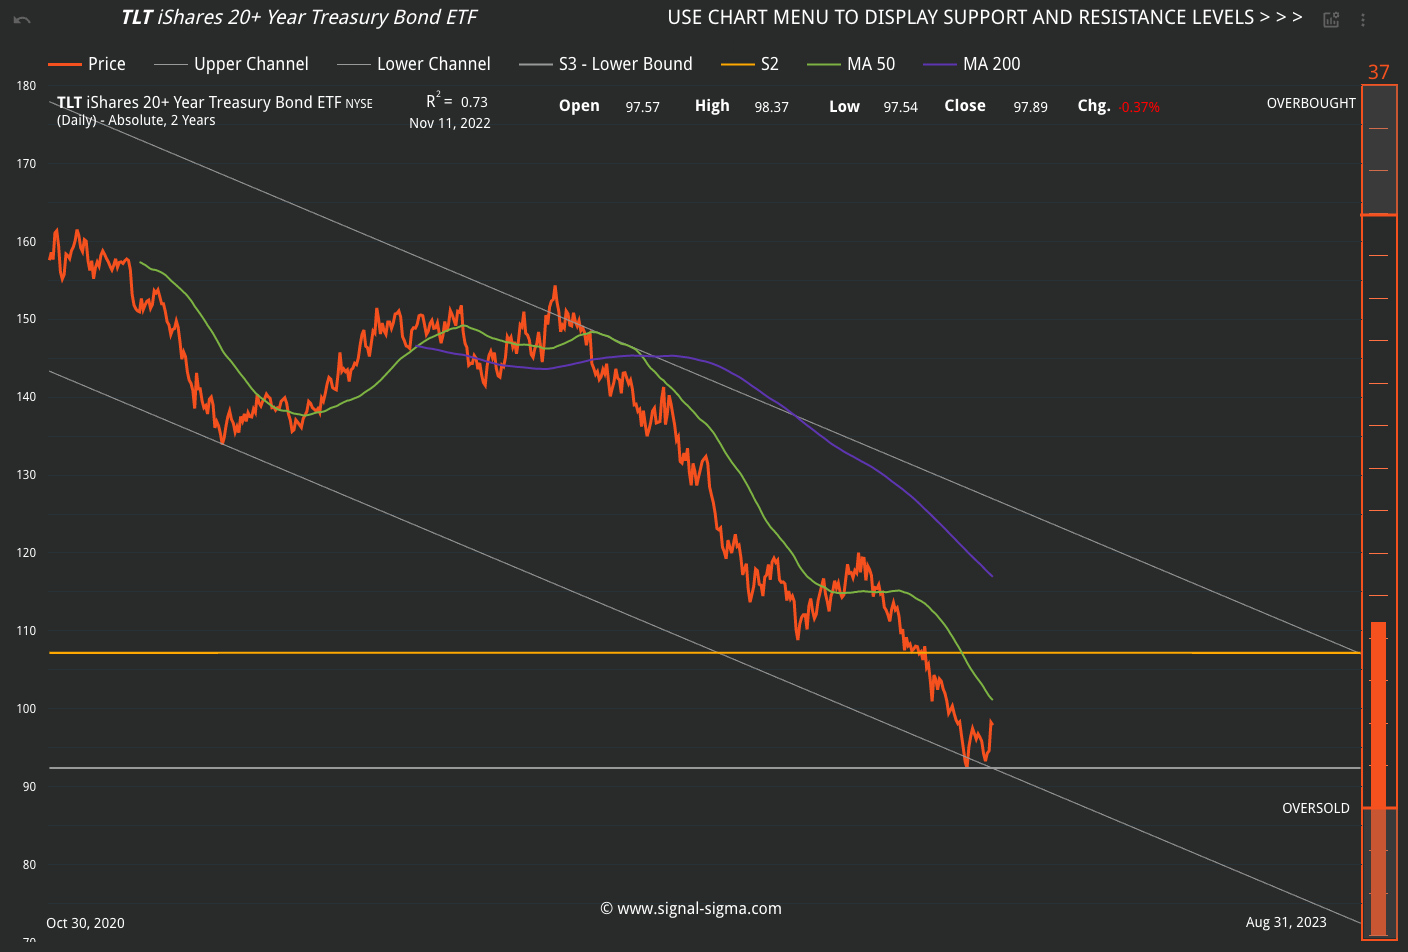
The inflation print moved the needle on more than just stocks. Yields plummeted across the curve, driving treasury prices higher. TLT is in a pronounced downtrend, and the small recovery that we have witnessed since Thursday has a lot of technical upside (up to $107). It is this asset class that we are watching closely, as there will come a point when bonds are going to make up a significant part of our portfolio again.
The positive price action in TLT is supportive of risk assets (especially the ones that are MOST risky). Along with the rise in treasuries and stocks, the US Dollar suffered one of the largest retreats, breaking through several technical support levels, and looking to have more downside still.
The current drawdown of UUP (US Dollar Bull ETF) is the largest on record in the past 2 years, sitting way below 2-Standard Deviations, with commensurate volatility. We will also be watching the dollar closely for signs it regains some footing in the following months.
The Inflation Report
What exactly caused all of this commotion in the first place? We take a look at individual inflation components and draw some conclusions.
Every category except recreation declined last month. The most pronounced fall was in Medical Care, on account of Medical Insurance, which is a quirk of seasonal data adjustment (Medical Insurance did not magically get cheaper in October). Also, for most Americans, health and housing costs are fixed through contractual agreements. It is the food, energy and goods inflation that is sapping disposable incomes. Since we know salaries are not increasing along with inflation, it is no wonder these are starting to decline.
However, the bullish narrative hangs on the hope of a “Fed Pivot”. It is our firm belief that Jerome Powell was well aware last week of these inflation numbers when he made the following statements:
“Even so, we still have some ways to go, and incoming data since our last meeting suggest that the ultimate level of interest rates will be higher than previously expected.
The historical record cautions strongly against prematurely loosening policy. We will stay the course until the job is done.”
For the Fed, a higher stock market represents “ammo” for more tightening. It is precisely the opposite of what they are trying to achieve. Therefore, hopes for a “policy pivot” will likely disappoint in the weeks ahead. Liquidity removal via QT is also running at twice the level that it was in 2018 (when the market took a 20% dive) and it is not going away at this point.
Takeaway
Algorithmic models, speculative traders and squeezed short sellers have jumped on the bandwagon of higher stock prices and dumped the dollar. The bond market reacted more cautiously. There is no fundamental change given data from the last inflation report, in our view. As such, we are treating the current price action as a bear market rally, one that is useful to reduce exposure (or outright short) into.
While the August rally had similar characteristics, there are now several major factors already trading with a negative slope (check out the charts for QQQ, MDY, SLY). Technical bear markets are forming, and they have yet to run their course. Inflation is most likely receding due to reduced spending and contraction in the economy, which will inevitably lead to an EPS recession. It’s hard to argue for higher levels in stocks at the moment, from a fundamental standpoint.
Our algorithmic strategies will rebalance tomorrow, and 2 out of 3 will require more than just a short-term surge in order to allocate to risk assets. In the discretionary Sigma Portfolio, we will give the rally a bit more room to run before committing extra resources to the short side.
Andrei Sota


