Portfolio Rebalance / November 22
Following the Signal Sigma Process
Tuesday is the day when all of our strategies rebalance their asset class holding weights. The approach to this article follows the step by step process described here.
Asset Class Allocation
The first step in determining optimal portfolio positioning is taking a look at the performance of the main asset classes, and determining which are suitable for investment. The Asset Class Overview Instrument gives us a clear macro picture.

Treasuries have become investible as well this week.
According to our methodology, all major asset classes would be fit to receive allocation from our system: Equities, Treasuries, Commodities and Gold.
What about CASH? The US Dollar is trying to reclaim support and is now sitting at the middle of its technical channel, bouncing from an oversold condition. The latest drawdown in the USD gave some respite to all of the other asset classes that have now become investible.
For clarification, the rules for an investible asset class are as follows:
If in an Up-Trend: price must be above the lower technical trendline;
If in a Down-Trend: price must be above the -0.5 St-Dev mark (trade significantly higher than the most recent lows).
All asset classes are viable options for allocation at this point.

With treasuries back in the allocation mix, Enterprise will aim to create a stock-bond portfolio. It will also aim to close out the position in commodities. The recent surge in both SPY and TLT has these instruments on a short-term Overbought state for now. A successful consolidation process would see them get added, in the following weeks. Commodities have seen their fair share of weakness, and would have to break the lower trendline in order to get stopped out (for DBC, that would mean closing lower than $24.03).
The Enterprise Strategy

Enterprise, our most conservative model, holds 40% exposure to commodities, and 60% cash.
Since this model only trades 4 asset class ETFs, we use it to judge overall portfolio positioning.
The strategy will aim to close out the position in commodities on the next available SELL signal. That could come as a result of a stop-loss, by breaching the lower trendline of DBC, at $24.03. DBC is already under selling pressure, and both the MACD and the WR% are near the lows - we would need to see these come back up first, before they can signal a SELL.
Equities are targeted for allocation at 90% of portfolio value. This sizable chunk of exposure will be bought on the next available BUY signal for SPY that DOES NOT VIOLATE support at the lower trendline ($386). We will most likely need to go through a consolidation phase first, as both the MACD and the WR% are currently positive. In order to signal a BUY, these have to turn negative first.
SPY is also getting compressed between the 20-day ($386) and the 200-day ($403) moving averages.
Treasuries are targeted for allocation via the TLT ETF, at 14% of portfolio value. Getting a BUY signal for TLT is much more tricky, because both the MACD and the WR% are highly extended and short term overbought. We would need to see a consolidation first, but that would most likely coincide with TLT trading below it’s stop level. We will most likely have to wait for a couple more weeks before committing to this position.
Cash reserves (USD) are at 60%, offering plenty of optionality. If all trades would trigger, CASH would be negative, as the strategy would employ leverage.
2. Sector / Industry Selection
The next step in creating our portfolio positioning is to break down each broad asset class into more granular groups of assets. This will help us understand which pocket of the market is outperforming or underperforming and make our selection accordingly.
Since Equities are now a viable asset class for investment, we will first take a look at how the different Factors are performing and see if there are any notable opportunities.

The first observation is that with the exception of QQQ (Tech) and IVW (Growth), every equity factor has been outperforming the S&P500 (See Z-Score Relative column and the positive pink columns in the right panel). This would give us plenty of options to choose from, if any of these factors were on sale. However, none of them are.
This week, all factors are trading above their 50-day Moving Average. It looks like a Goldilocks environment, where most factors are outperforming. It will be interesting to see how they hold up in a more negative environment, under selling pressure. That is where we are most likely to find the next winner.
For now, it looks like the Dow and Value ETFs (DIA, IVE) are overextended and ripe for a pullback. In a rotation scenario, money could flow from these more traditional factors to the growth part of the universe that is currently underperforming (QQQ, IVW). We will keep an eye out for this sort of action, although yields will surely play an integral part to any serious capital flows to growth stocks.
The same situation is found when looking at Sectors as well.

XLK (Tech), XLY (Consumer Discretionary), XLC (Communications) and XLRE (Real Estate) are the sectors that are NOT outperforming, even given the current rally. All of the other sectors are relative out-performers, and are not currently “on sale” - none of them are trading below the 50-day Moving Average.
Industrials and Staples (XLI, XLP) look egregiously overbought, while Real Estate, Tech and Consumer Discretionary could be the beneficiaries of a rotation in flows.
As such, there is no clear preference when it comes to Sector selection on the equity side either. As a consequence, SPY is targeted for exposure in the Nostromo model.
The same logic applies to bonds as well, with TLT being targeted.
Commodities fall out of the portfolio targeting this week.
The Nostromo Strategy

Nostromo, our tactical allocation model is starting the week with 100 % cash positioning.
The strategy will perform almost identically to Enterprise this week.
The only difference between the two models lies in the exposure to commodities. Enterprise needs to close that position, while Nostromo does not need to bother with commodities almost at all (the residual position is a hedge from former positioning and is not material).
For more info about how Nostromo targets sectors or factors within a broader asset class, read this article. The first part sheds some light on the selection process going on in the background.
3. Individual Stock Selection
At current levels, Horizon will form a portfolio of 10 stocks and buy them at the close. This model is the most aggressive and has no need for any other confirming signals. The logic by which its internal selection process works is similar to the new Momentum + Quality Stock Screener.
We expect several of the following stocks to make it into Horizon’s final portfolio:

Horizon Strategy

Horizon, our most aggressive strategy, will rebalance the equity portfolio so that each position keeps its equal weight (9% of NAV).
Horizon is closing the position in DBA, in accordance to the targeting instructions of Enterprise and Nostromo, which have removed commodities from the allocation plan.
Similarly, Horizon will add TLT with a 14% weight, to complement the stock portfolio.
Favoring a risk-taking approach, Horizon will not wait for any other signal and simply fill the orders.
Horizon is the type of trend following strategy that is currently on a “short-squeeze” rampage, in a move similar to August’s bear market rally. It does, however, maintain a tight stop on the equity side, and close all positions if SPY trades below $386 by this time next week.
CASH will sit at -4%, indicating a small amount of leverage is being employed.
Horizon’s equity portfolio will be primarily correlated with the Industrials and Basic Materials sectors - showing the best momentum so far. It should be noted that Industrials seem heavily overbought at this point (BDC, EME, EXTR, RMBS and SANM positions).
4. Market Environment
The next step in our process is to take into account the type of market environment that we are currently trading in. For these purposes we use the Market Internals and the Market Fundamentals Instruments. Comments on the overall state of the market can usually be found in our Weekly Preview Article.
Overall, we find that conditions are Overbought and extended both on a market-wide basis and an individual stock basis, although less so than last week. The last time we have seen similar positioning from our strategies (Horizon goes all-in on stocks while Enterprise and Nostromo hold back) was in August, the peak of a bear-market rally.
We must assume, for now, that the environment is changing to favor a range-trading approach rather than a trend-following approach. This will lead us to construct a long-short book in the Sigma Portfolio.
If Enterprise or Nostromo start to get long equities, we will close all short positions in the Sigma Portfolio and start to tilt bullish as well.
5. Trading in the Sigma Portfolio
After reviewing all of the above factors, it’s time to decide on the actual investing strategy for our real-life portfolio.
First of all, we will take an average of CASH position sizing from all of our models. This will come down to roughly 52%, with a minimum and maximum of 100% and -4% respectively. We are at a stage where our models are in dissonance with each other in terms of actual allocation, but starting to converge on the same target portfolio.


Using a defensive Market Environment view, we can safely allocate up to 48% to something other than CASH.
In the Sigma Portfolio, we are comfortable with the exposure that we have now. More specifically, the portfolio is 13% Long, 21% Short and 4% allocated to Commodities. We will let the market dictate our next move.
A successful period of consolidation in the equity market will determine ALL of our models to dump cash and get long risk assets. If Enterprise or Nostromo start to get long equities, we will close all short positions in the Sigma Portfolio and start building long positions.
If we get another surge in equities, without triggering a MACD SELL signal first, we will acquire more inverse exposure (SH, PSQ, RWM).
If the consolidation fails at the lower trendline support or the 50-day Moving Average support, we will also look to sell the remaining long positions, so that our portfolio turns completely short.

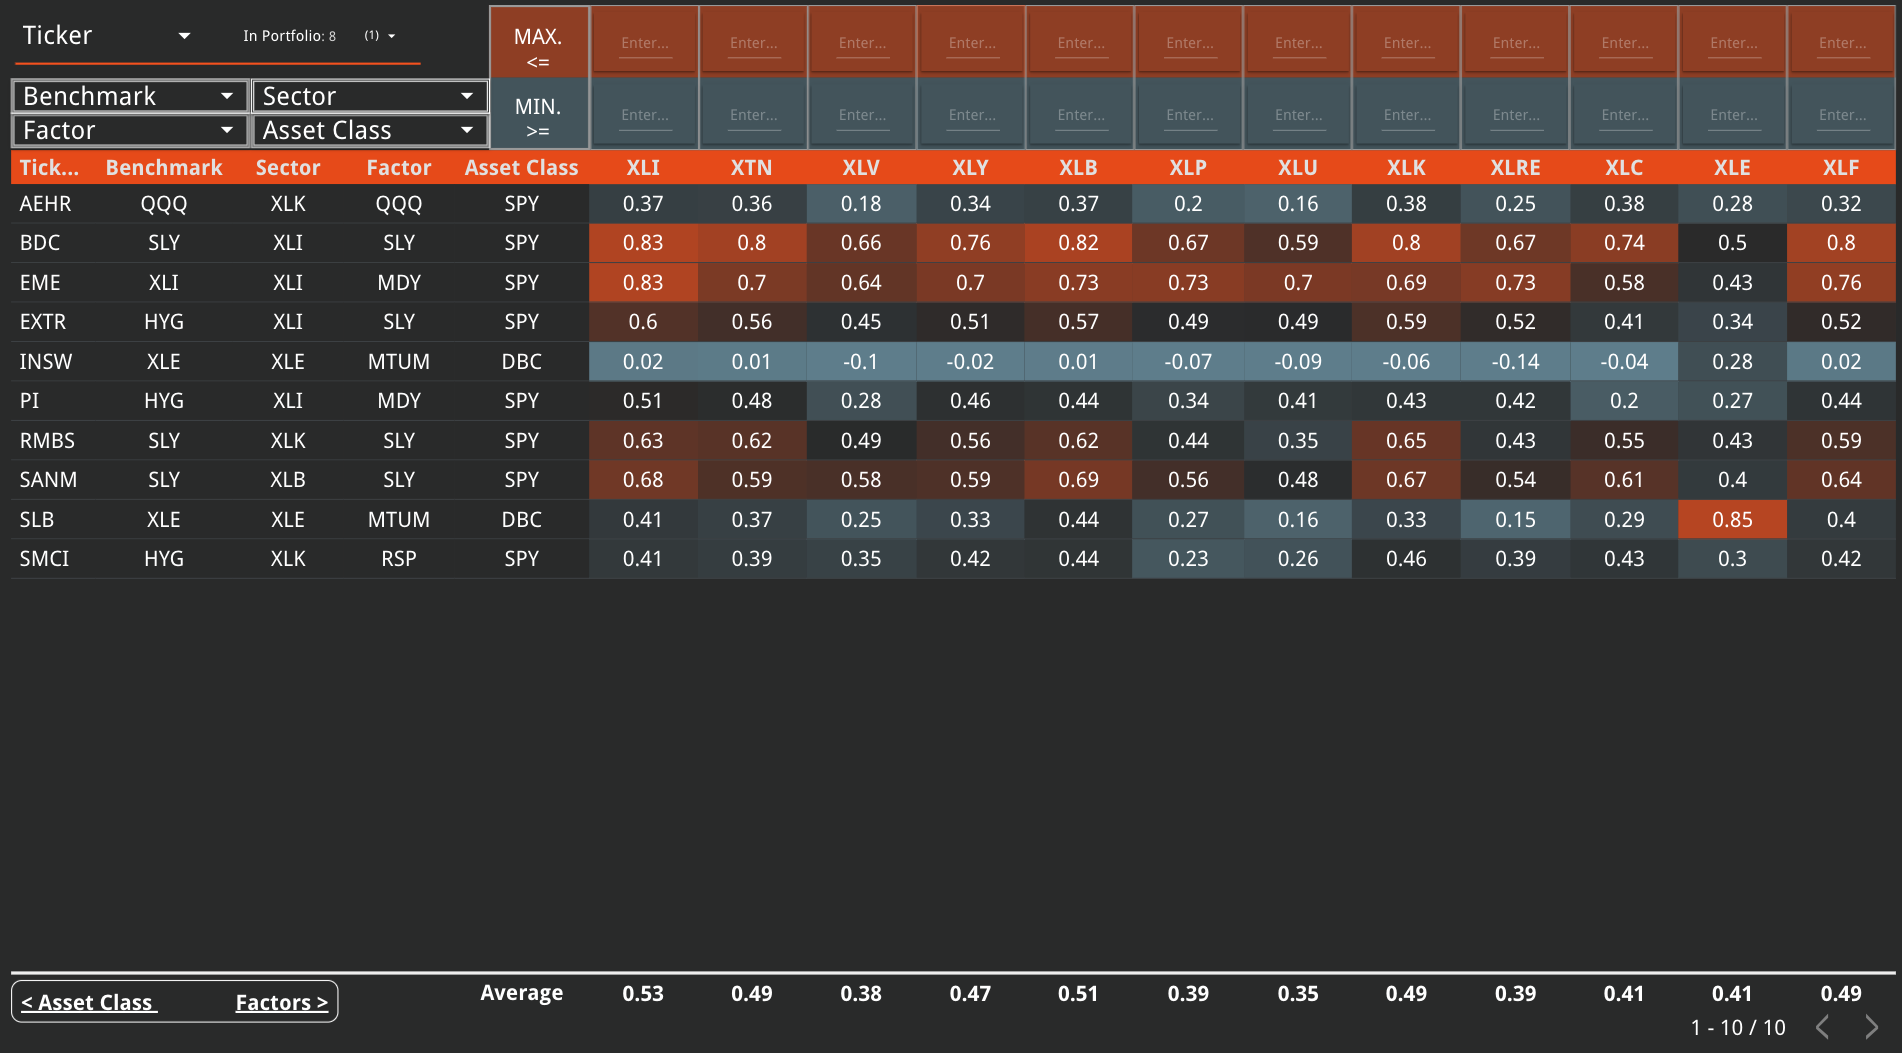
According to the Correlation Screener above, the Sigma Portfolio contains two positions that might be prone to a technical pullback: GPC and ADM. These are highly correlated to DIA and IVE - both factors which we have identified to being highly extended. We will look to trim these positions in favor of more general exposure.
Andrei Sota