Weekly Preview / November 21
Notable Events on our Weekly Watchlist:
Monday: Chicago Fed National Activity
Earnings: A, DELL, ZM
Tuesday: EU Consumer Confidence
Earnings: BBY, HP, ADSK, DLTR, VMW
Wednesday: Durable Goods Orders, Jobless Claims, New Home Sales
Earnings: DE
Thursday: Markets Closed - Thanksgiving
Earnings: N/A
Friday: Partial Trading Day - Thanksgiving
Earnings: N/A
ETFs to watch: SPY, XLY
Rangebound trading expected in holiday-shortened week
Last week we discussed the overbought nature of the equity market, with many of our indicators pushing more extreme deviations. The rally did not extend to our target level of 407 and momentum seems to be waning. Most algorithmic strategies are now fully invested in the rally and prone to start triggering stop-loss orders if a more meaningful breakdown in prices should occur. That is why, technically speaking, this week we should be mindful of a range-bound consolidation pattern and the way this plays out in the following weeks.
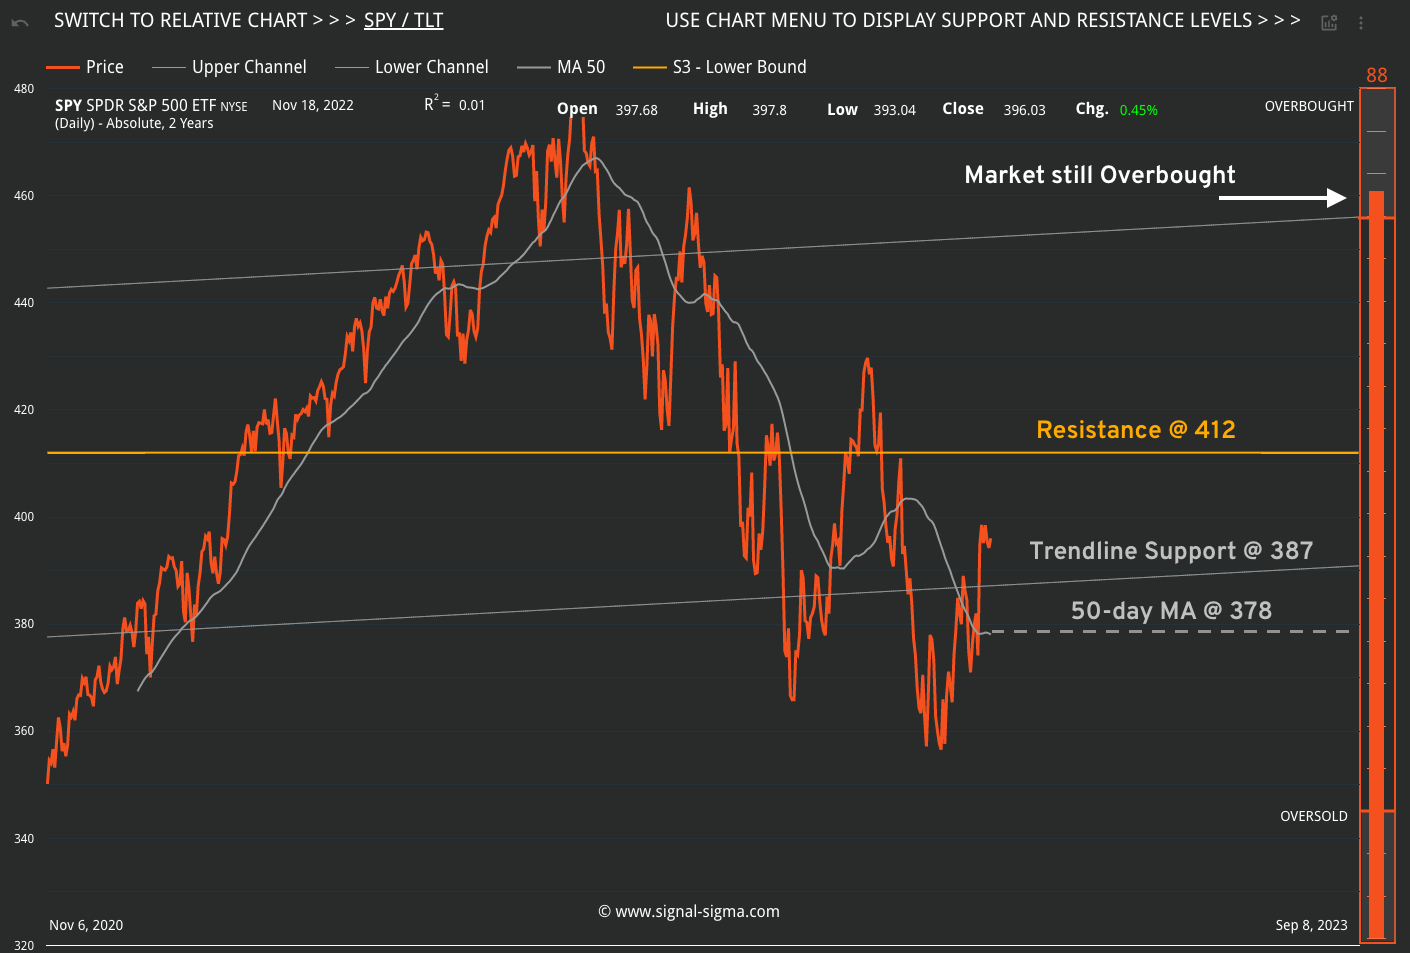
With the SPY still in Overbought territory, the trading range has now widened as follows:
Resistance: 412 (up from 407 last week)
Support: 387 (down from 388 last week)
50-day MA: 378
Here’s the complete technical picture:
SPY Analysis
The increased trading range is due to the slowly deteriorating long term technical picture. With each week that the market spends in drawdown (without setting new all-time-highs), the trading channel is sloping downward. Right now, it is still trending positive, but if the situation does not improve rapidly, we will most likely start developing a negative trend.
A negative trend will be a strong signal that we are indeed dealing with a bear market, and our strategies will start behaving differently in this environment. What is needed to “save” the situation then, and maintain a positive trend (and the bull market alive)?
A consolidation that does not violate support.
In order maintain a functional and healthy rally, the market needs to consolidate (trade sideways to down) around recent levels. Healthy consolidations following a rally usually tend to “test” recent levels of support that have been breached during the advance. These levels must hold, in order to signal that the price action is “for real” and not just another bear market rally. Ideally, a MACD BUY signal should trigger above 387, after the price bounces off the 50-day MA.
Of course, in order for a MACD BUY signal to trigger, it first needs to register a SELL crossover - that is when we will know to be on the lookout for a bounce.
Let’s examine the breadth of the market, by following one of our most useful instruments: the Market Internals.
The Market Score (69) is lower than SPY’s score (88) - this signals to us that the limits for a rally have been reached, and the advance is starting to lose steam. We are still trading near the upper 2 standard deviations for this measure, but in a less extreme way. The number of Stocks Overbought is high (416/1000), but also below the 2-Stdev line.
Another bearish clue that indicates the rally is starting to lose steam is the average Dollar Transaction Volume, that has dropped off a cliff.
That simply means that there are less buyers able to meet sellers at prevailing market prices. This behaviour in volume usually translates to at least a short-term directional change in prices. Also, note the bearish trend developing in transaction volume since the Fed has started QT and is actively removing liquidity from the markets.
TLT Analysis
Arguably more important than the price action in the equity market are the developments in the treasury market. TLT has long been on our radar for a reversal of the current bear market. Last week, we have indeed witnessed some positive developments, with the price advancing to the 50-day MA, but not able to clear it. In order to have a healthy rally in the equity market, yields must stop rising (the price of TLT has to stop dropping).
With the 2-10 yield curve deeply inverted at -0.69%, a recession warning is sounding loud and clear. While using the yield inversion as a “market timing tool” is inefficient, dismissing the message from the bond market is also unwise. Historically, it’s been the “un-inversion” of the yield curve that precedes market downturns, as the Central Bank pivots when the economic picture has worsened dramatically. We don’t want to be invested in equities at that point - most of the money will flow to treasuries instead, in a perceived safe-haven bid.
A part of this “flight to safety trade” has been prevalent in the past couple of sessions, as TLT has traded inversely to QQQ and SPY. This trend is still new, but worth keeping an eye on.
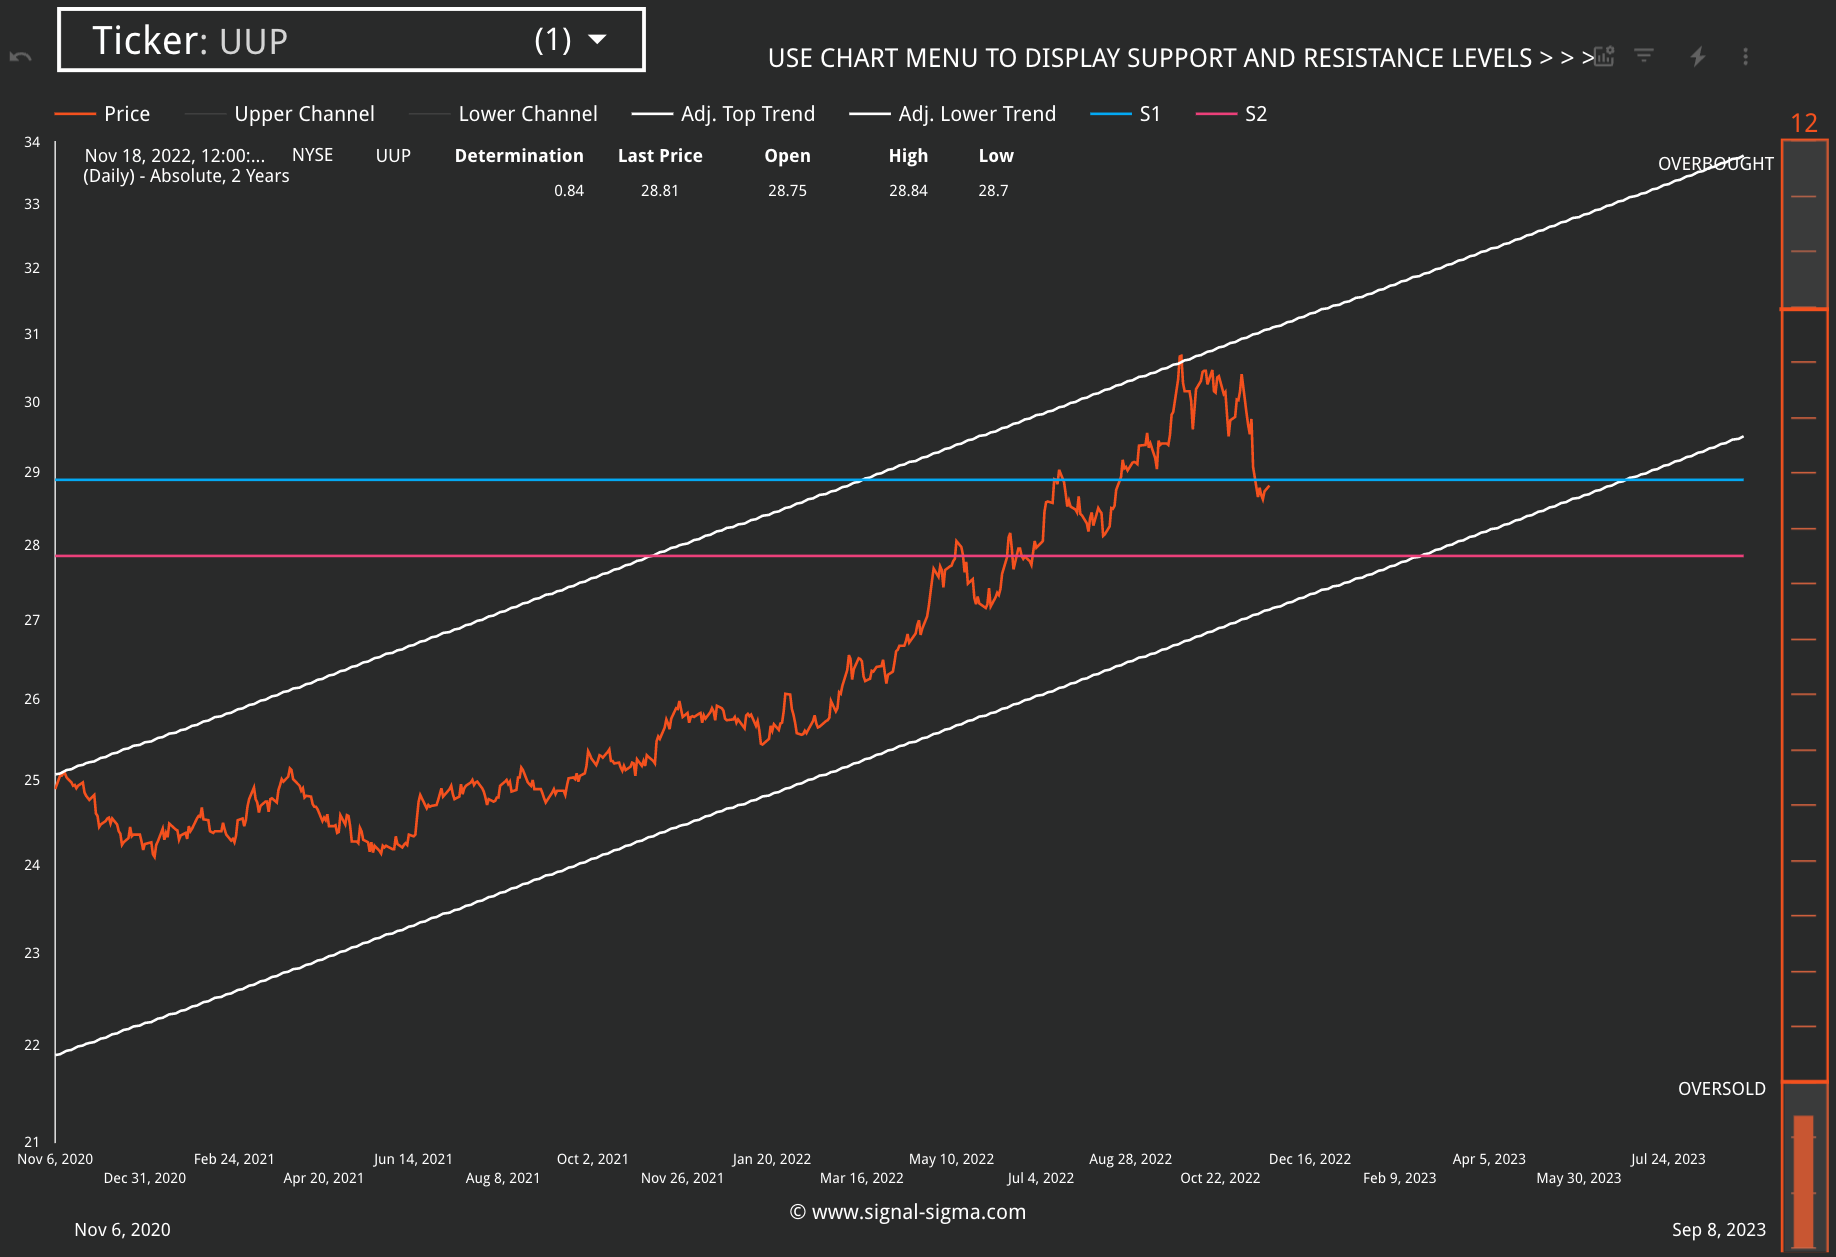
The US Dollar is still trading below key support, and is still Oversold, although slightly less so than last week. If UUP (US Dollar Bull ETF) manages to clear overhead resistance at 28.89, it will most likely coincide with softness in every other asset class.
Market Fundamentals
As the quarter’s earnings reports are drawing to an end, we find it worthwhile to review the aggregate metrics for S&P500 constituents using our Market Fundamentals Instrument.
As seen in the charts, Gross Margins are still under pressure and unable to bounce from the recent lows. Inflation is eroding the consumer’s spending power and companies are unable to push costs over to them. It is no surprise then, that Gross Margins are under pressure, and are likely to remain so in Q4’22. A contraction in gross margins to the 10-year average would imply a further 2% drop from 48.55% to 46.25%.
Combined with Revenue Growth that is also slowing down markedly, this trend points to an imminent contraction in EPS, which is still near cycle highs. We probably haven’t seen a real slowdown in EPS just yet as accounting gimmicks (including share buybacks) keep this number elevated.
In the event of a sudden slowdown in the economy (as implied by the yield curve) and a Reversion to the Mean (not crash) in revenue growth and gross margins, we will probably see EPS take a substantial hit. As more of this scenario is priced in by analysts, expect to see price targets get cut and estimates revised lower.
At 400 on SPY, the market is substantially overpriced from a fundamental perspective. The Fed has not even hinted at switching to an accommodative policy stance at the moment.
Takeaway
We don’t plan on trading too much this week - there are no important fundamental or technical catalysts to go on right now.
Instead, the main expectation is related to a consolidation in prices that may or may not break support. Mind the fact that at this juncture, the trading range is wide! SPY can fall by 4.5% and still hold support at the 50-day MA.
If, for whatever reason we get a rally to the 410-412 area, we will use the opportunity to reduce exposure further, in the Sigma Portfolio. Essentially, this juncture is the perfect place to employ a wait-and-see approach, and let the markets tell us what to do next.
It all depends on holding support at the moment.
Andrei Sota


