Portfolio Rebalance / November 15
Following the Signal Sigma Process
Tuesday is the day when all of our strategies rebalance their asset class holding weights. We will take a new approach to this article format, better following the step by step process described here.
Asset Class Allocation
The first step in determining optimal portfolio positioning is taking a look at the performance of the main asset classes, and determining which are suitable for investment. The Asset Class Overview Instrument gives us a clear macro picture.

What a difference one week makes!
According to our methodology, three asset classes would be fit to receive allocation from our system: Equities, Commodities and Gold. Last week, only Commodities would make the cut. Suddenly, more options are on the table besides CASH.
And speaking of CASH, the US Dollar has suffered the largest drawdown of the past 2 years, breaking several technical support levels.

It’s no wonder then, that given this macro technical setup, our strategies will want to heavily allocate towards risk, and pare back bets on the safety of CASH.
Given the fact that SPY and DBC are currently in an UP-trend, the system will prefer these rather than Gold. This preference is manifested in the “Target Amount” column for each model. In other words, the system “wants” to execute a certain trade, but waits for the appropriate signal before actually filling the order.
The Enterprise Strategy
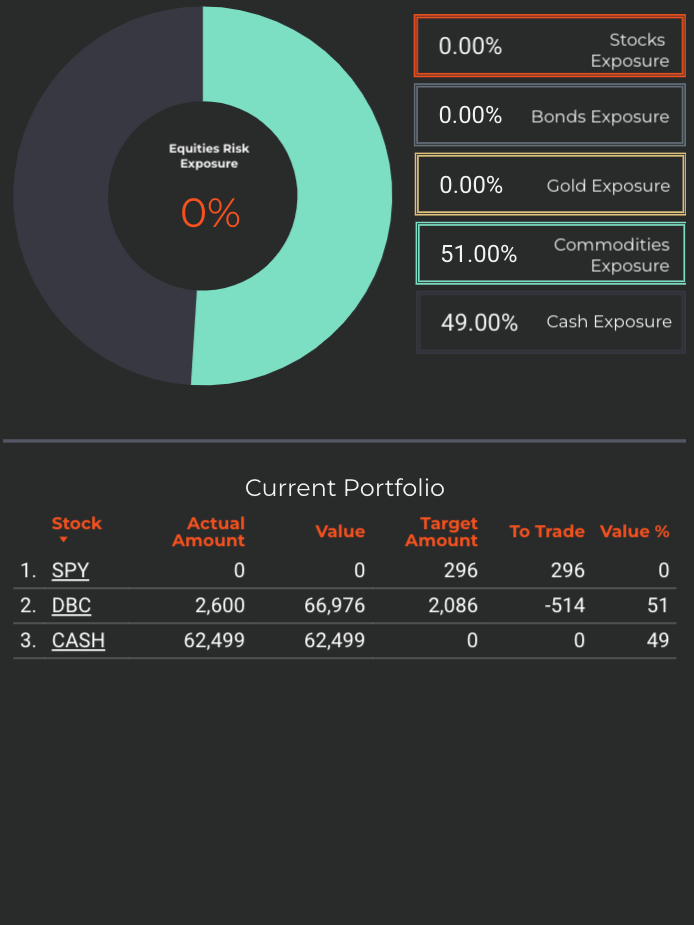
Enterprise, our most conservative model, holds 52% exposure to commodities, and 48% cash.
Since this model only trades 4 asset class ETFs, we use it to judge overall portfolio positioning.
The strategy will aim to decrease exposure to commodities on the next available SELL signal. The decrease will be significant, cutting about 20% of the current position. There is a high chance of a MACD SELL signal occurring in the following week.
Equities will also be heavily purchased, if SPY will trigger a BUY Signal. Up to 90% of total portfolio value will go towards allocation to SPY. However, as discussed below, this possibility is unlikely.
Cash reserves (USD) are at 48%, offering plenty of optionality.
How would a BUY Signal on SPY look like?
In order to not get “fooled” by a bear market rally, both Nostromo and Enterprise have a built-in safety signal. It is designed so that the position will not be filled while in an Overbought state. Either signal could qualify, if triggered:
Trend Continuation Signal
The trend continuation principle aims to buy securities that are coming out of a recent consolidation pattern. We use a MACD cross Signal to identify these opportunities. Right now, for SPY, here is how the MACD signal looks like:
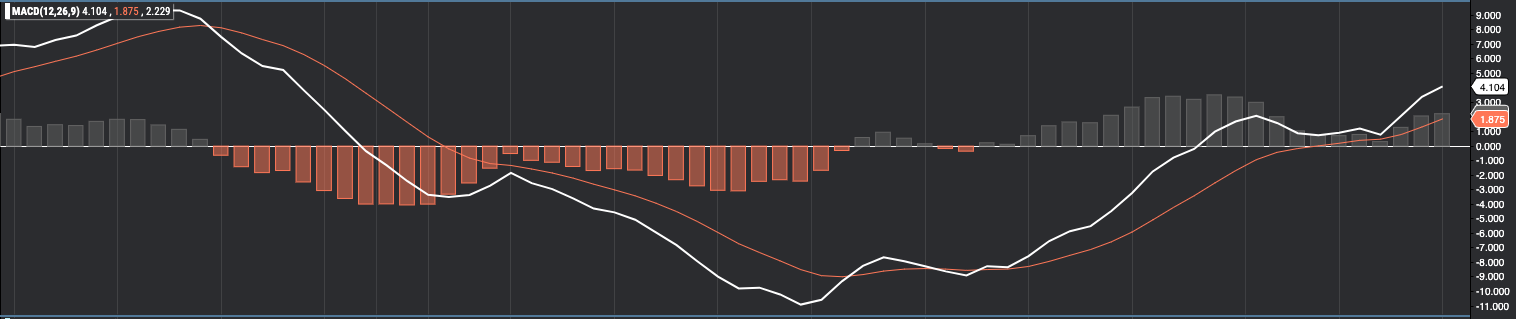
It is reasonably extended to the upside. In order to generate a BUY, the short EMA (white) has to cross below the long EMA (red) and then back up again. This action is highly improbable for the next week. If SPY would consolidate, and trigger this signal while still inside the technical channel, then Enterprise would allocate towards equities.
Trend Reversal Signal
The second principle that we are looking for is to “buy the dip”. In order to isolate a trend reversal point, we use several filters. The first one is the Overbought/Oversold indicator that you see on every chart on the right side. This has to read 20 or less, in order to qualify for a trend reversal trade. For SPY, the current reading is 90/100. There is a long way to go until we reach 20 or less, and by that point, we would be outside the trading channel anyway.
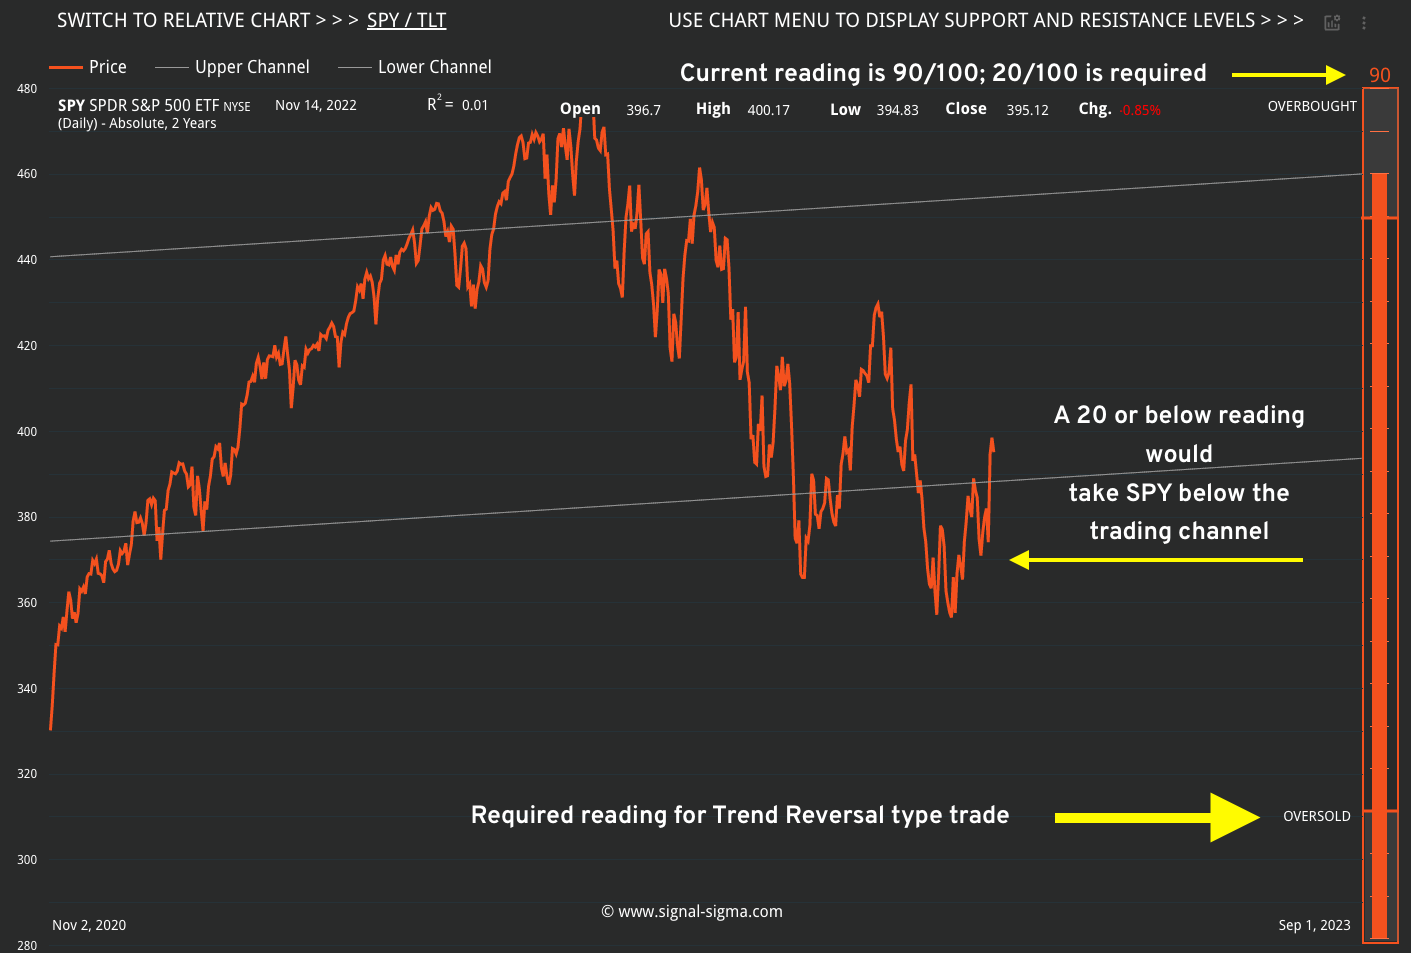
It is safe to say that for now, both Enterprise and Nostromo view the current setup in SPY as a bear market rally.
2. Sector / Industry Selection
The next step in creating our portfolio positioning is to break down each broad asset class into more granular groups of assets. This will help us understand which pocket of the market is outperforming or underperforming and make our selection accordingly.
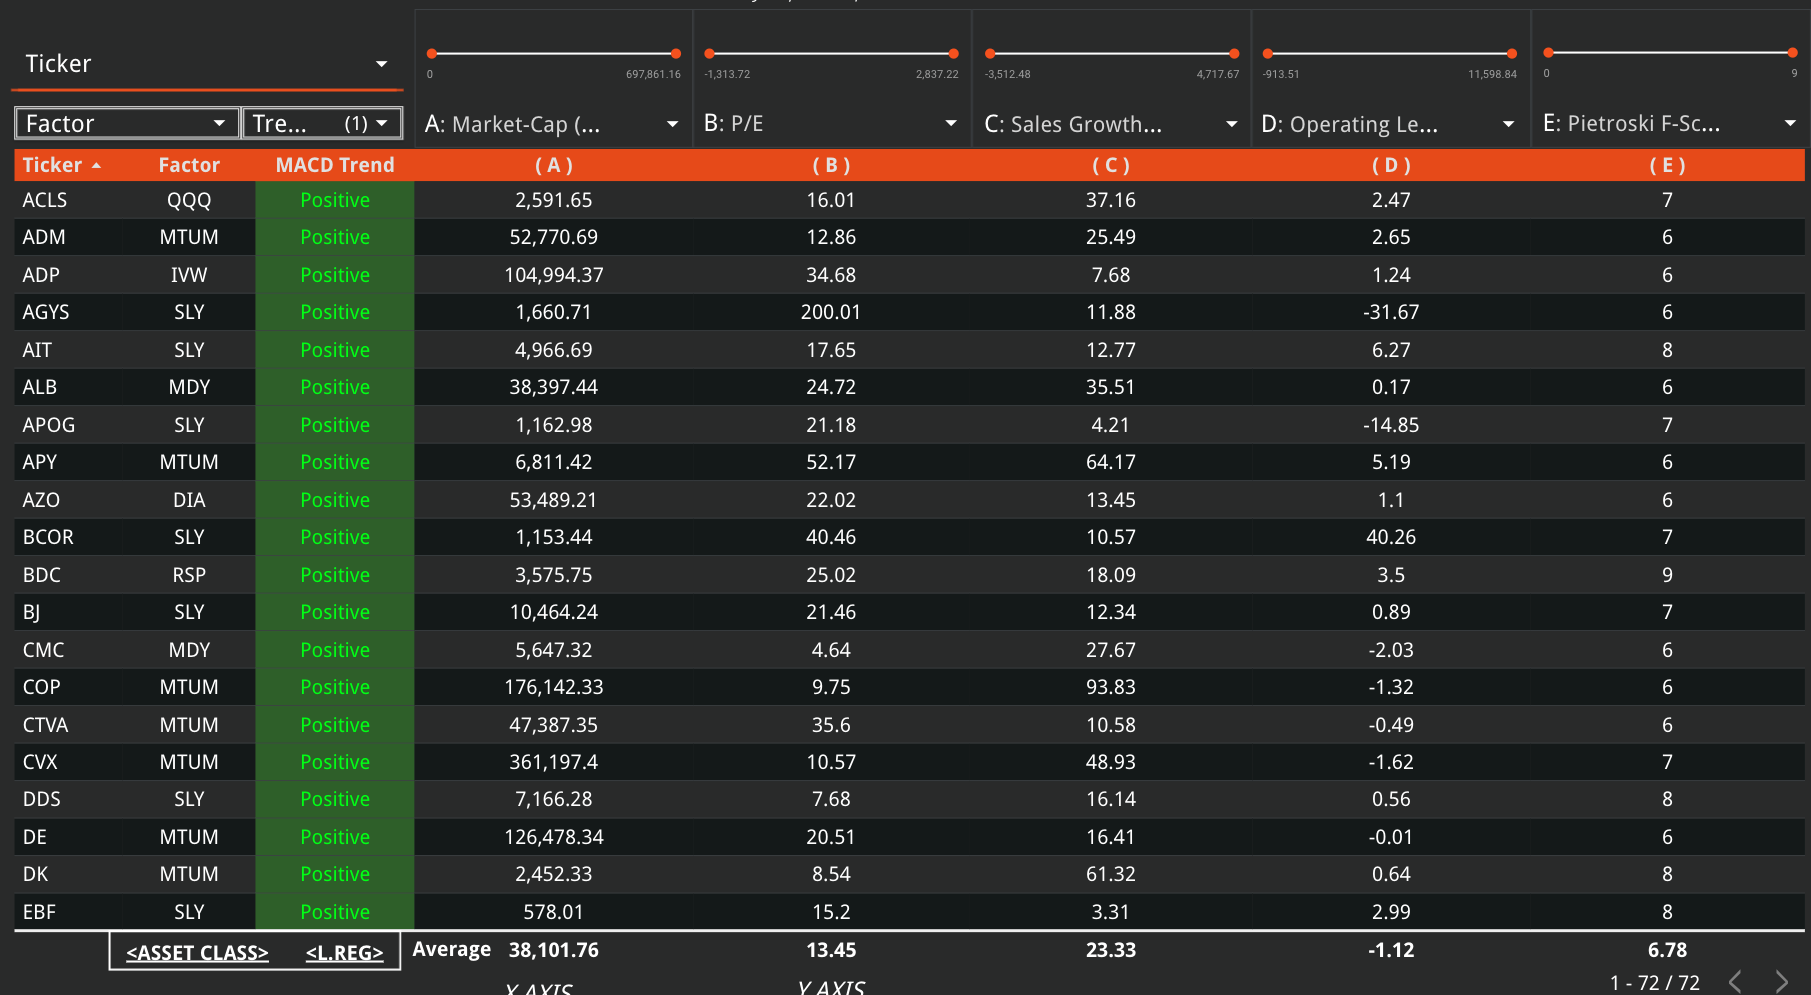
Since Equities are now a viable asset class for investment, we will first take a look at how the different Factors are performing and see if there are any notable opportunities.

The first observation is that with the exception of QQQ (Tech) and IVW (Growth), every equity factor has been outperforming the S&P500 (See Z-Score Relative column and the positive pink columns in the right panel). This would give us plenty of options to choose from, if any of these factors were on sale. However, none of them are.
With the exception of IVW, QQQ, EFA and EEM, all equity factors are trading above both their 50 and their 20 day moving averages. In other words, there is no clear standout in performance. The recent tide has lifted all boats, and only when the tide recedes can we pick out some winners.
The same situation is found when looking at Sectors as well.

By working the selection logic the other way around, the only Sector ETFs trading below the 50-day Moving Average are XLY and XLU (blue columns in left panel). However, these sectors are not current outperformers, as their Z-Relative score is below 0.
Industrials and Basic Materials look heavily overbought, while Real Estate is the only notable drag from the group.
There is no clear preference when it comes to Sector selection on the equity side either. As a consequence, SPY is targeted for exposure in the Nostromo model.
On the commodity front, exposure to DBA would be preferred instead of DBC (the same logic is applied to Commodity-related ETFs).
The Nostromo Strategy

Nostromo, our tactical allocation model is starting the week with 100 % cash positioning.
The strategy will look to buy DBA (agricultural commodities) on the next available BUY signal.
This is unlikely to occur in the following trading week, as the ETF has triggered such a BUY signal while simultaneously below the trend that would act as a Stop-Loss; this has resulted in the strategy not doing anything with the position. DBA is looking to be short-term overbought at the moment as well.
SPY would need to trigger a BUY signal as discussed above in order to receive allocation.
For more info about how Nostromo targets sectors or factors within a broader asset class, read this article. The first part sheds some light on the selection process going on in the background.
3. Individual Stock Selection
At current levels, Horizon will form a portfolio of 10 stocks and buy them at the close. This model is the most aggressive and has no need for any other confirming signals. The logic by which its internal selection process works is similar to the new Momentum + Quality Stock Screener.
We expect several of the following stocks to make it into Horizon’s final portfolio:
Horizon Strategy
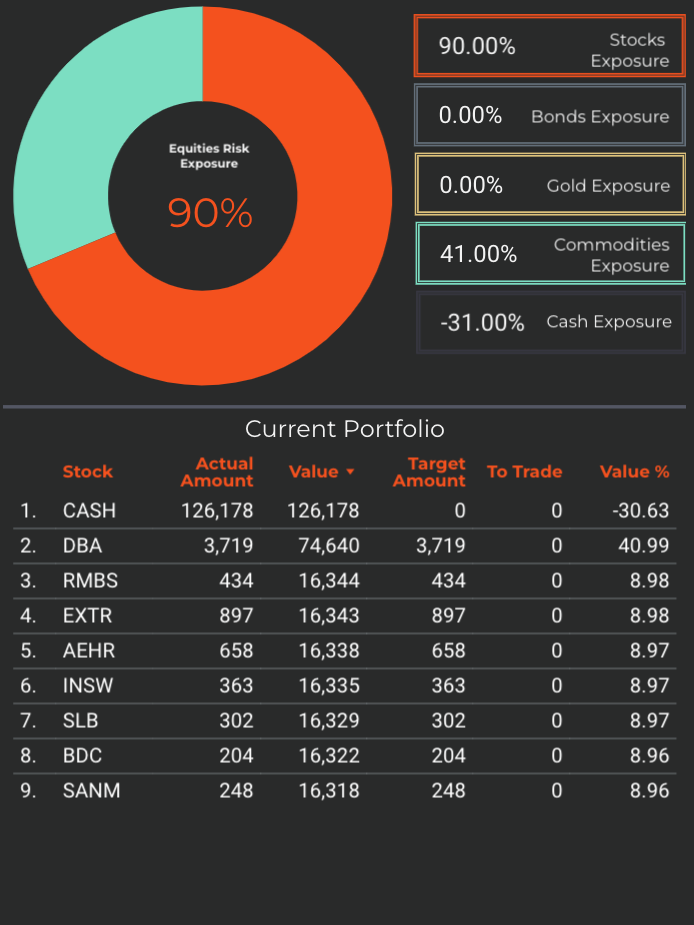
Horizon, our most aggressive strategy, will rebalance to an equity portfolio while also keeping 41% exposure allocated to commodities.
The model will employ significant leverage and take CASH to a -31% allocation.
Favoring a risk-taking approach, Horizon will not wait for any other signal and simply fill the orders at today’s close.
Horizon is the type of trend following strategy that is currently on a “short-squeeze” rampage, in a move similar to August’s bear market rally.
Horizon’s equity portfolio will be primarily correlated with Industrials, Basic Materials and Tech sectors - showing the best momentum so far.

4. Market Environment
The next step in our process is to take into account the type of market environment that we are currently trading in. For these purposes we use the Market Internals and the Market Fundamentals Instruments. Comments on the overall state of the market can usually be found in our Weekly Preview Article.
Overall, we find that conditions are Overbought and extended both on a market-wide basis and an individual stock basis. The last time we have seen similar positioning from our strategies (Horizon goes all-in on stocks while Enterprise and Nostromo hold back) was in August, the peak of a bear-market rally.
We must assume, for now, that the environment is changing to favor a range-trading approach rather than a trend-following approach. This will lead us to construct a long-short book in the Sigma Portfolio.
5. Trading in the Sigma Portfolio
After reviewing all of the above factors, it’s time to decide on the actual investing strategy for our real-life portfolio.
First of all, we will take an average of CASH position sizing from all of our models. This will come down to roughly 40%, with a minimum and maximum of 100% and -31% respectively. We are at a stage where our models are in dissonance with each other.


Using a defensive Market Environment view, we can safely allocate up to 50% to something other than CASH.
In the Sigma Portfolio, we are adding to our commodities exposure, so that we are better aligned with the allocation of Enterprise. We are also building short-exposure positions via inverse ETFs (SH, PSQ, RWM), taking the other side of Horizon’s trade.
I will concede that when and if Enterprise or Nostromo will allocate to SPY, all hedges will be removed from the Sigma Portfolio. That would indeed signal that conditions have improved enough.

The Sigma Portfolio is now 13% Long 21% Short on the equities side, and 4% allocated to Commodities. Long equity positions in the Sigma Portfolio are most correlated to the Momentum Factor.
The plan is to increase short positions on a continuation of the rally, and then wait for either a consolidation that takes us net-long again or a breakdown in prices that would only leave short positions on the book.
Andrei Sota