Weekly Preview / October 31
Notable Events on our Weekly Watchlist:
Monday: EU Inflation, EU GDP
Earnings: CAR, NXPI, ON, XPO
Tuesday: Caixin Manufacturing, ISM Manufacturing, JOLTS
Earnings: AMD, ABNB, CRUS, DVN, EA, LLY, MSTR, PFE, PSX, SPG, UBER
Wednesday: Fed Interest Rate Decision, ADP Employment
Earnings: ALB, BKNG, GOOS, EL, ETSY, FSLY, FTNT, LL, MRO, QCOM, ROKU, HOOD, Z
Thursday: BoE Interest Rate Decision
Earnings: GOLD, SQ, CI, CROX, EXPE, MAR, PYPL, PTON, TWLO, W
Friday: Non-Farm Payrolls, Unemployment Rate
Earnings: DKNG, D, DUK,
ETFs to watch: SPY, XLK, XLV, XLE
Not Great, Not Terrible
Despite some high profile earnings reports last week that put downside pressure on individual stocks (META -23%, GOOG -8%, MSFT -6%, CMG -5%, AMZN -7%), the overall performance of equity indices was broadly positive. The S&P500 managed to gain 3.56%, while small caps (SLY) and the equal-weighted S&P500 (RSP) outperformed convincingly with gains of 6.12% and 4.82% respectively.
The resilience of the equity market in front of a raft of weak results is encouraging news for the bulls - maybe too encouraging at this point, since markets are starting to become short-term overbought. Articles and tweets are coming out in support of the thesis that a new bull market is on the horizon and a Fed pivot is close by.
In this article, we will go through both the bull and the bear cases and decide on strategy and positioning for the medium and the short term at the end. This week features several important Central Bank decisions (the Fed, BoE), the latest Eurozone Inflation number, Non-Farm Payrolls and Unemployment data. Volatility is bound to surface, as several influential tech, healthcare and energy companies are due to release their latest earnings results.
SPY Analysis

Technically, SPY has completed a good part of the rally we were calling for. It took out the 380 resistance level on Wednesday, and this level in return should become support (short term). We could see a bit of consolidation here, as the deviation from the 20-day moving average is high both at the index level and for individual stocks.

833 / 1000 stocks trade above their 20-day MA; this measure has reached 900+ in previous bear-market rallies
Further catalysts for a rally include the midterm elections (statistically positive for stock market returns one year out) and the corporate buyback window, which fully opens in November. Both are influential factors for gains that occur in the last months of the year:
Since 1950 there have been 18 midterm election cycles, with an average 12-month return of 18.56% vs 10.6% in all of the other years. Stocks have never had a negative return in any of these instances, with 1986’s 4% gain being the weakest.
Buyback authorizations this year sit at a record $1 Trillion which will potentially equate to roughly $4.5-5 Billion in daily flows into equities through year-end.

Dollar transaction volume has turned higher on this rally, bucking the recent QT induced downtrend. Volatility still remains elevated for the time being.

Add to this that many trend following models are buying dips at current levels and we can conclude that there are good technical reasons for which a rally might endure in November and December. Our own Horizon Strategy will initiate equity risk positions if SPY closes above 392, echoing the thinking of many quant systems employed by hedge funds.
The price target for this final leg of the rally is 404 - 410, between the 200-day Moving Average, and the S3 Level.
What about bonds and the Dollar?
Pre-requisites for a convincing equity market bottom are falling yields and a weaker US Dollar. Both these metrics will turn lower if the Fed would reverse its rate hike and QT campaign. However, as noted in previous articles, there are currently not enough fundamental reasons for them to do so at this stage.
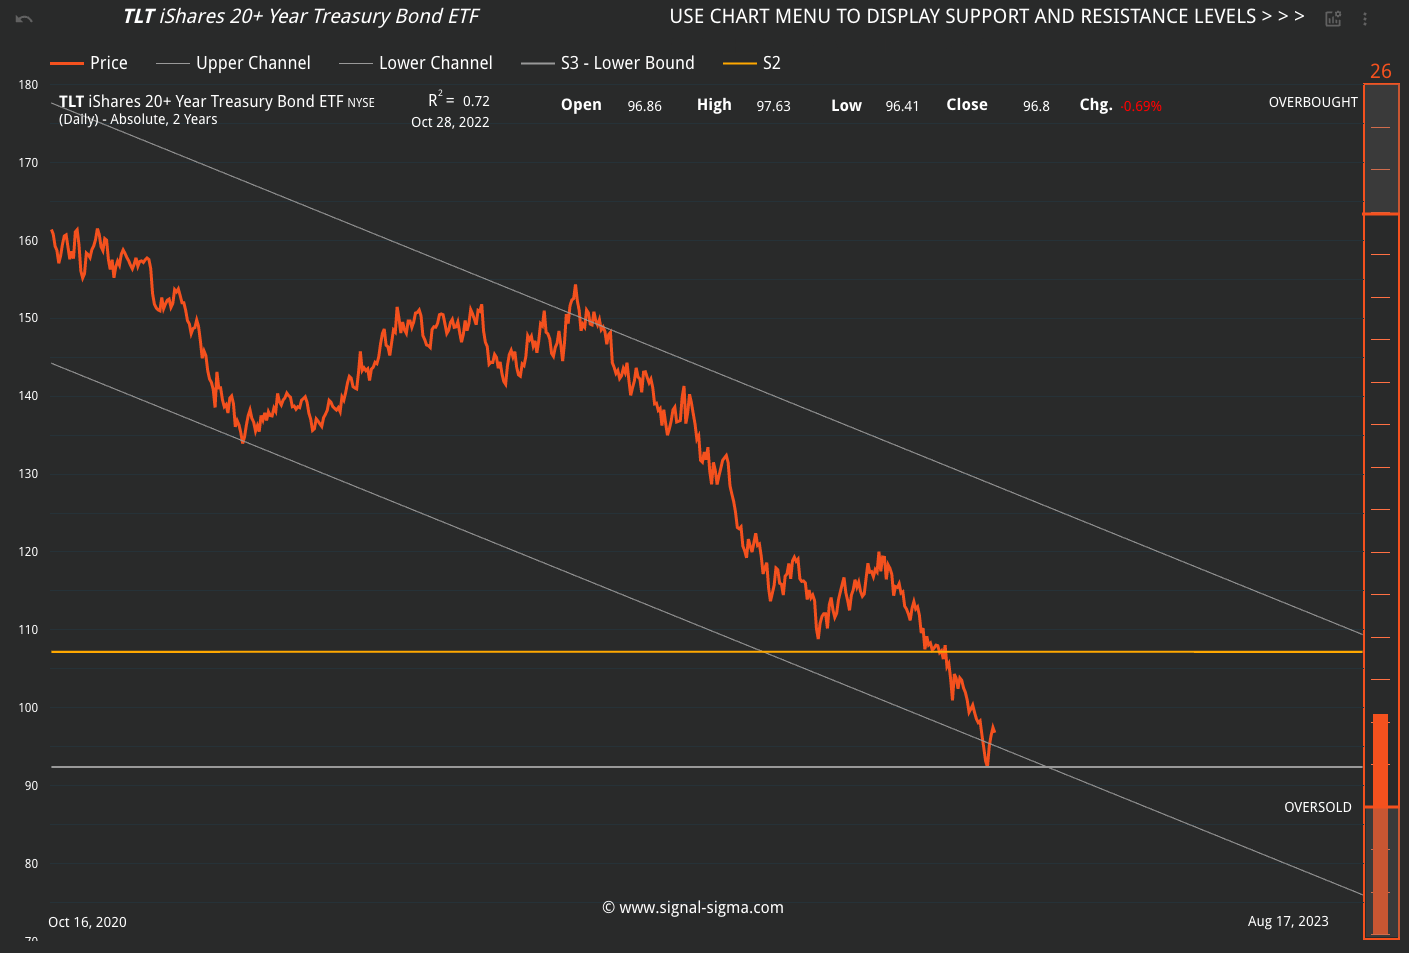
Long term government bonds performance has improved slightly, with TLT bouncing off the lower channel trendline, and opening up the possibility of a rally to $107. The chart below displays the SPY/TLT ratio, often used to determine weather the next period will bring better returns for stocks or bonds. When the upper trendline is hit, bonds are expected to outperform stocks. Viceversa when the lower trendline is attained.
Right now, we are seeing one of the highest deviations in this ratio, suggesting better returns are ahead for TLT rather than for SPY.

The US Dollar

The US Dollar (that has been a wreaking ball for every asset class this past year) is finally seeing some softness. Support is currently holding just below Friday’s close, but a break lower would suggest some material downside, to the levels last seen in July ($28.5 on UUP). The fundamental reason for this scenario would have to be a dovish tone from the Fed.
Takeaway
Short term, the risk-reward equation continues to favor the bulls. As the markets are getting a bit extended here, we are more likely to see consolidation this week, rather than a surge higher. This is not a place to initiate new longs or shorts, but rather a neutral area.
Longer-term, we need to seriously consider the prospect of a recession in the US. The 3 month - 10 year yield spread has turned negative last week, and this signal has preceded every recession in the past. It has taken between three and thirteen months from the trough of the yield curve inversion until the official NBER recession declaration.
As a recession in 2023 becomes a near-certainty, the only way to profit from the (still expensive) equity market would be to flip allocation to net short. Timing short positions is always a challenge and at some point we will be in direct contradiction to our Horizon Strategy (which will become a buyer above SPY 392). However, we will employ our various instruments on the platform to pinpoint the best time to reverse course and profit from a drop in prices. If we are wrong, it will be easy to become constructive once again.
Andrei Sota