Portfolio Rebalance / August 23
Following the Signal Sigma Process
The approach to this article follows the step by step process described here. All visuals are sourced from various instruments available in the platform.
Yesterday, our automated models have aggressively allocated toward equity risk in their simulated portfolios. Some, more than others. We have also followed part of their reasoning in the Sigma Portfolio, and are looking for a bit of extra insurance before pulling the trigger on more risk.
In today’s article, we explore the state of the market and what we can expect in the short and medium term.
Asset Class Allocation
The first step in determining optimal portfolio positioning is taking a look at the performance of the main asset classes, and determining which are suitable for investment. The Asset Class Overview Instrument gives us a clear macro picture.

According to our analysis, all major asset classes are technically investible at this point. Gold, Commodities and Equities have bounced. Treasuries have not, and are flirting with the Stop-Loss (non-investible) level.
We’ve projected the correction across asset markets for a while. Now, it’s finally here. Where do we find the best opportunities? We explore each major asset class below, starting with equities.
SPY, the benchmark ETF for stocks, has nearly touched our correction target of $431 intraday, last Friday. Since then, it has managed to rebound from very oversold short term conditions and triggered a BUY from our systems. We are inclined to believe upside is rather limited at this point (the 50-DMA and the R2 level sit just above). Longer term, the trend remains solidly bullish.

Commodities have failed to break out of an increasingly tight range. While no longer overbought (score is 75 / 100), DBC seems to have avoided a technical breakdown as well. Sooner or later, we’ll have a better idea of where prices will end up, but right now, the ETF is a bit directionless.

Gold is treated by our system as an alternative to equities at the moment. The logic is 3 fold: both equities and gold represent inflation hedges. Both would benefit given lower yields. Both have technically outperformed recently.
Please excuse the busy chart. Gold is now very oversold in the short and medium term. Similar to equities, it has managed to bounce in a reflexive manner, nearing support. However, both the 50 and the 200 day moving averages are trading above the last close and will put technical pressure on the yellow metal. Absent a strong performance, Gold might end up at $170 (green line, near the lower part of the channel), before putting in a durable bottom.

Meanwhile, the U.S. Dollar is stubbornly overbought and maintains a “breakout” posture. What is less obvious is that the Dollar’s momentum is slowing (take a look at the MACD indicator, below the main chart). It looks like a topping process in the making.


Treasuries, which represent deferred Dollars, have been slammed into technical support ($92.4 on TLT - S3). Investors are becoming convinced that the Fed will maintain rates “higher for longer”. Economists are projecting another positive quarter with no recession on the horizon, and sticky core inflation. At this rate, holders of long term government debt are losing 21.2% every year in capital depreciation.
Needless to say, this is not sustainable in a service-based economy. Bonds might offer up the best long term investment opportunity out of all asset classes, over the next 18 to 36 months.

Enterprise, our core strategy, has levered up big time.

Enterprise, our most conservative model, doesn’t look very cautious at this juncture. It has thrown cash out the window (-81% allocation) in favor of stocks, bonds and gold.
Since this model only trades 4 asset class ETFs, we use it to judge overall portfolio positioning.
Enterprise is looking to completely close its position in Gold. Since GLD is oversold and hasn’t triggered any SELL signal, the strategy is maintaining its position.
The strategy is looking to add to TLT on a suitable BUY signal.
Cash allocation is at negative 81%. This rather massive use of leverage is fully intentional and is meant to compensate for periods when the strategy is under allocated. Right now, it is grossly compensating.
2. Sector / Industry Selection
The next step in creating our portfolio positioning is to break down each broad asset class into more granular groups of assets. This will help us understand which pocket of the market is outperforming or underperforming and make our selection accordingly.
Since Equities are an investible asset class, we’ll take a look at how different Factors are performing and check for any notable opportunities.


We have included tables for this week and the prior 3 weeks in order to help you compare developments (click on the arrows or thumbnails to cycle through the tables).
All factors are now on a Negative Medium-Term Trend. Just 2 weeks ago, all factors were on a positive trend. Just as we said then, we’ll say it now - the fact that all factors align in this way is more of a sign that oversold conditions are prevailing, than anything else. However, they could all remain on the same negative trend for a couple more weeks, before a reversion occurs.
On a short term basis, no factor is actually oversold. They are all trading below the key 20 and 50 day moving averages, with Emerging Markets (EEM) appearing to be the most pressured.
Longer term, Nasdaq (QQQ) and Growth Stocks (IVW) continue to be highly extended, but ever more to a lesser extent. To the downside, the Equally Weighted S&P500 (RSP) and the Dow Jones Industrial Average (DIA) look to be the relative-to-SPY losers. all other factors sit somewhere in the middle.
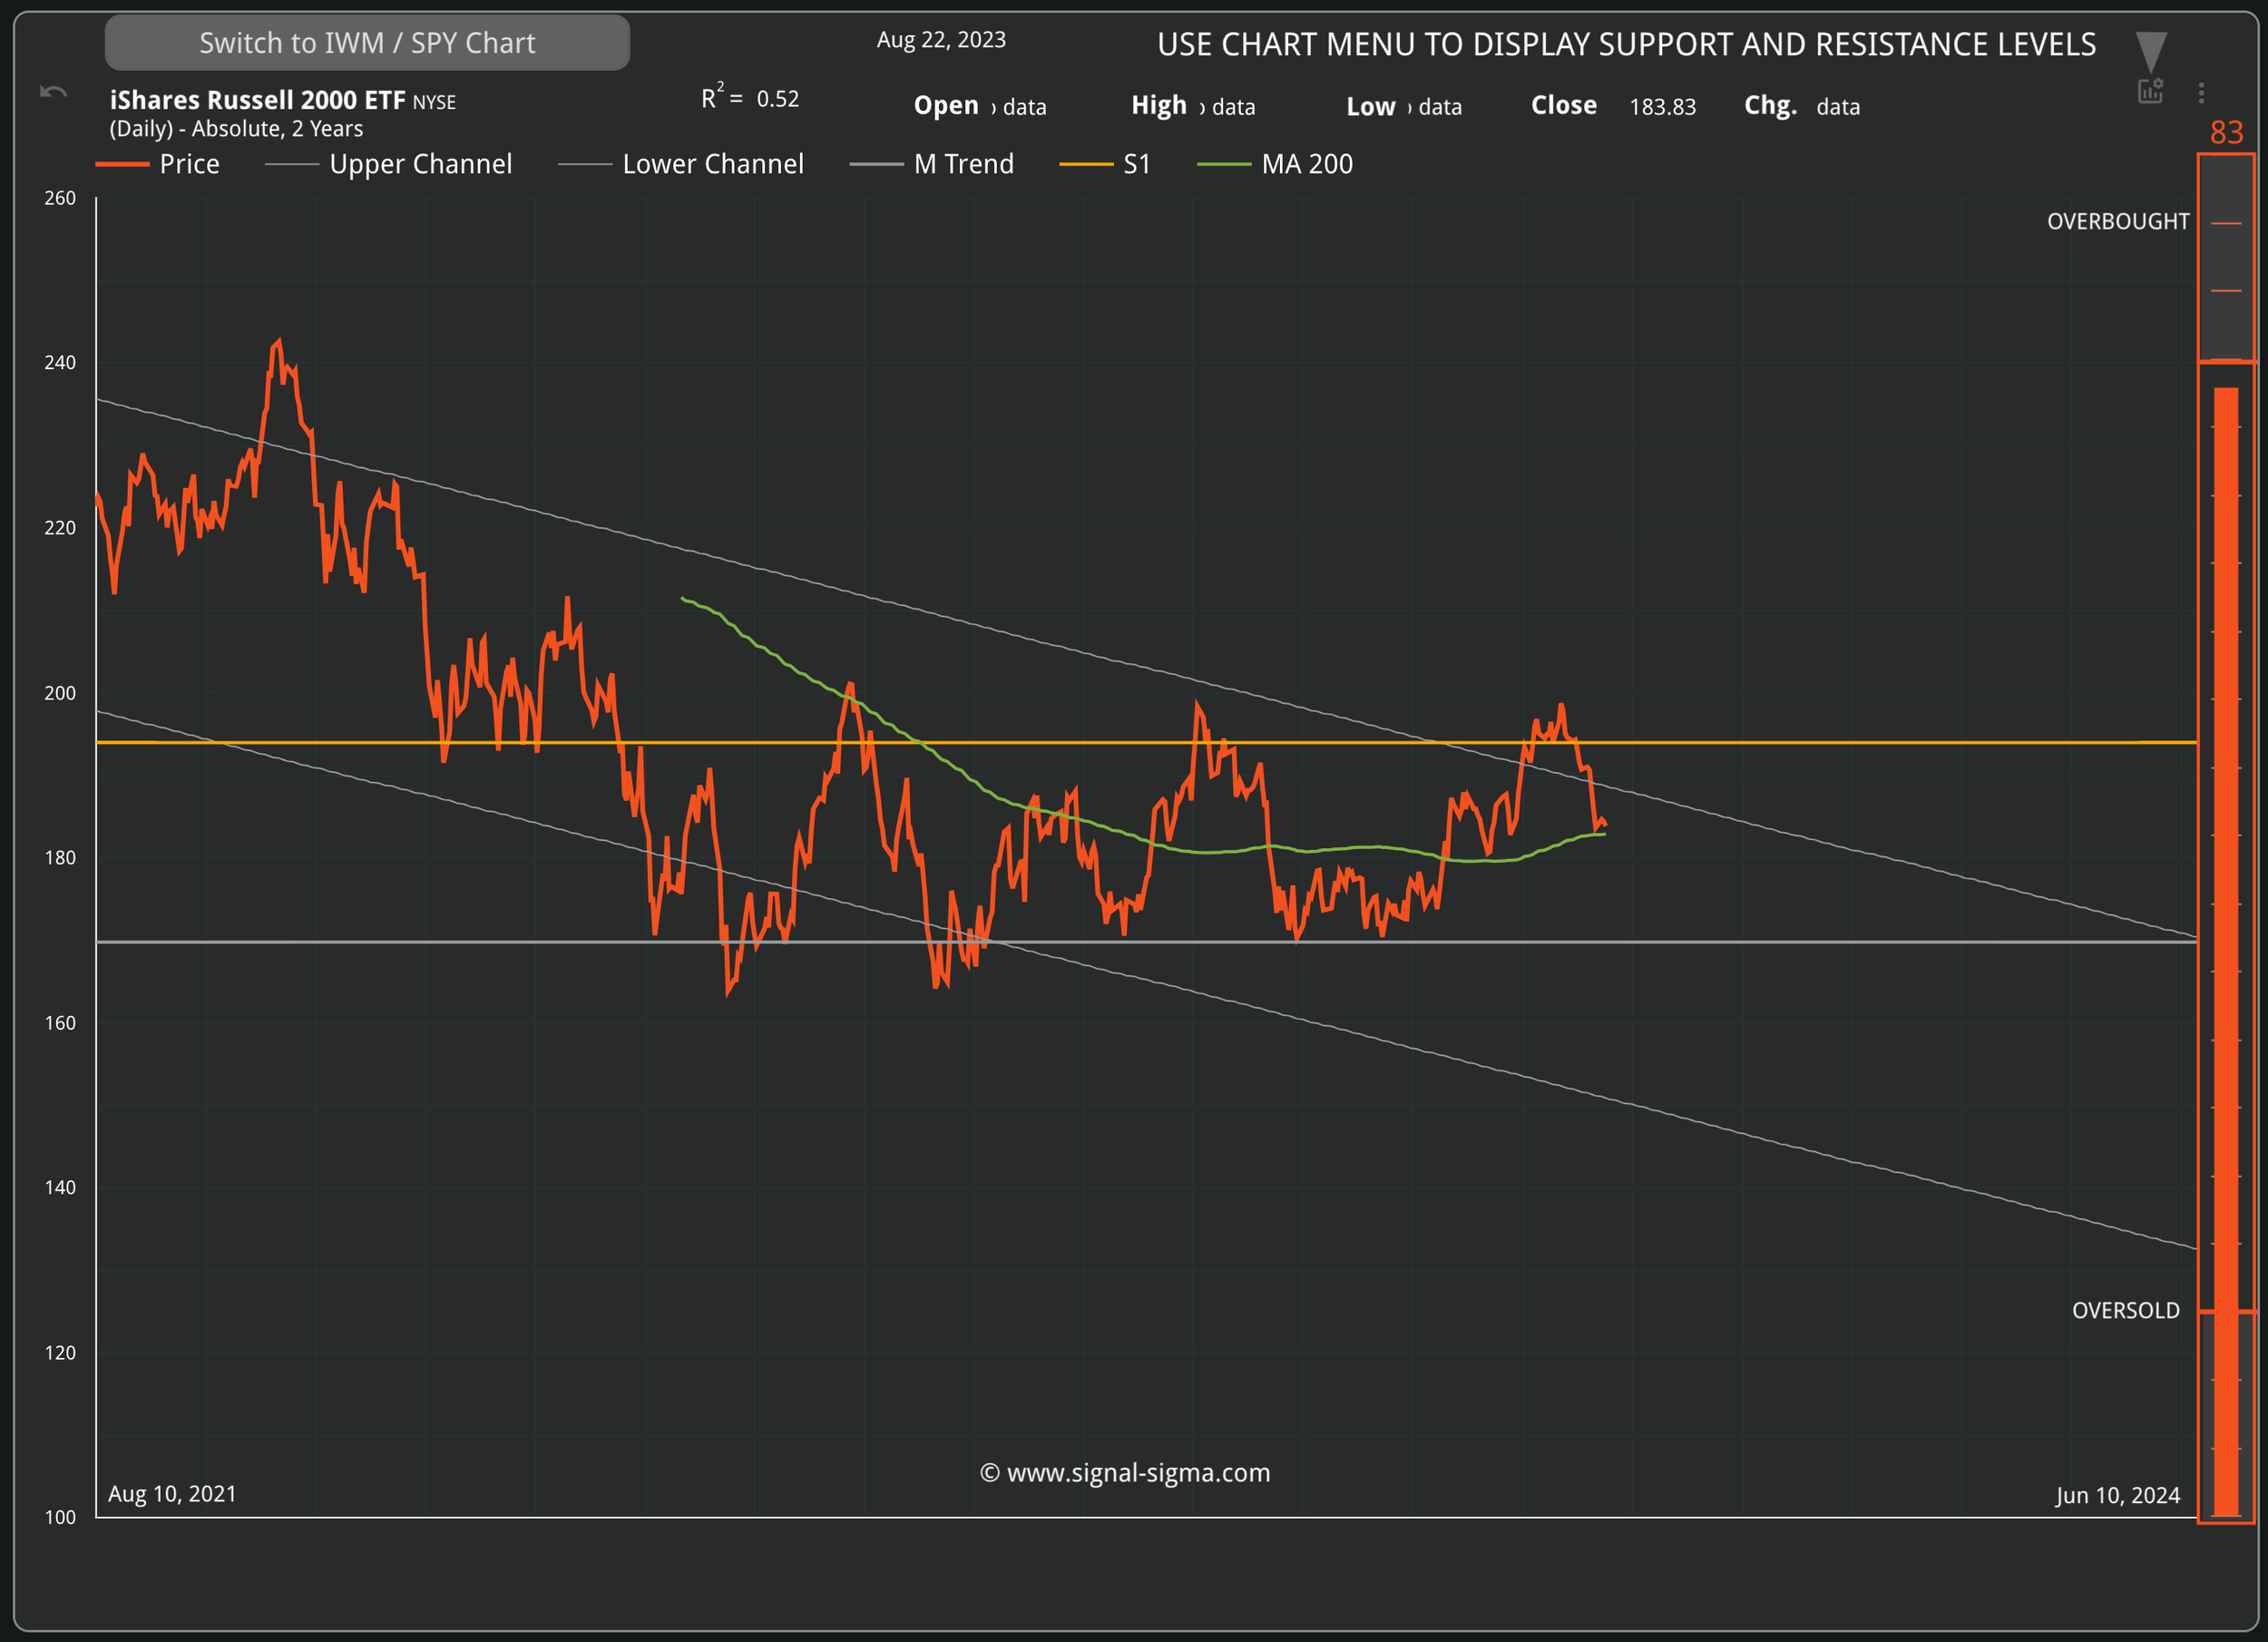
The iShares Russell 2000 ETF (IWM), a factor that we closely follow for clues about market breadth, has dipped below its trend-line, but has found support at the 200-DMA for now. A true breakout remains elusive for the economically sensitive part of the market.
According to our analysis, a tactical opportunity has presented itself (and we’ve taken full advantage of it):
Growth Stocks (IVW)
Nasdaq (QQQ)
They are both relative out-performers and are currently oversold enough to warrant attention. Signals have triggered for QQQ but not for IVW yet.
Here’s how we stand on the Sectors front:


We have included the last 3 weeks of tables as well, for your convenience.
On the Sectors side, the negative trend is creeping up as well. Only Energy (XLE), Healthcare (XLV) and Financials (XLF) are still positive so far. We’ll take this as a sign things could go worse.
In the short term, no sector is yet oversold. Notably, Energy (XLE) and Financials (XLF) are showing relative strength, by being the only ETFs trading above the key 50 moving average.
Longer term, it’s Utilities (XLU) and Staples (XLP), that are oversold both on an absolute and on a relative-to-SPY basis.
There are notable tactical opportunities in the high beta sectors. These have corrected the most, and may offer attractive entry points on a trade signal:
Tech (XLK)
Consumer Discretionary (XLY)
Transports (XTN)
Communications (XLC)

Nostromo, our tactical allocation model, has also added to risk exposure. It’s just doing so at a more relaxed pace than Enterprise.
That’s a consequence of the strategy splitting each major ETF into more granular positions. It has allocated 41% in QQQ, but not yet IWM (the other stock ETF it’s looking to go long).
It’s also looking to adjust bonds positioning, by reducing TLT and adding to TIP, IEI, LQD and MBB (less volatile ETFs).
However, the required signals need to trigger for each particular ETF before orders get issued.
Nostromo continues to hold a 27% cash position, that helps with optionality.
For more info about how Nostromo targets sectors or factors within a broader asset class, read this article. The first part sheds some light on the selection process going on in the background.
3. Individual Stock Selection
Our Stock Screener is back online, so we’ll be looking for quality companies to buy on the pullback.
We’ll start by selecting XLY, XLK, XLC and XTN on the sector correlation column, so we’ll only deal with stocks that trade in a similar way to the ETFs that hold the best tactical opportunity. Here are the screener settings:
Pietroski F-Score > 6 (quality component)
Z-Relative > 0 (outperforming the benchmark ETF)
Positive Earnings Yield
We’ll then set column A to Market Cap and column B to Return on Assets so that we can visualiza a scatter plot.. Here’s the outcome:


We would find the higher market cap companies investible for now. ADBE, BKNG, ANET, ADSK, ORCL look to as as worthy candidates for inclusion in a portfolio. We can study their financials using the Fundamentals Explorer, and model their Price Target / EPS Growth Rate using the Valuation Wizard.

This week, we will spotlight the Millennium Momentum portfolio which is primarily allocated to Energy and Industrials names. Just 10 stocks make up this portfolio, and they have been on a tear lately, delivering 8.5% returns in the last 3 months (versus its MTUM benchmark, at 3.0%).
This portfolio is certainly not for any investor, but if you are looking to add some quality RSP / MDY / XLE / XLI exposure to your own holdings, make sure to check it out!

4. Market Environment
The next step in our process is to take into account the type of market environment that we are currently trading in. For these purposes we use the Market Internals and the Market Fundamentals Instruments. Comments on the overall state of the market can usually be found in our Weekly Preview Article.
No change from last week’s commentary:
Market breadth in terms of moving averages is recording a pullback, and for the moment the Sigma Score differential between SPY and the broad market is normalizing (this is good). For now, this instrument looks like it is in the middle of a consolidation.
Neutral - Bearish Signal in Stocks trading above their 200-day Moving Averages

As a contrarian indicator, sentiment works best near extremes. Right now, we are in the lower part of the sentiment band, with a “Fear” reading. We would be inclined to buy in “Extreme Fear”, and we’re not there yet.
Slightly Bullish Signal in Sentiment

In terms of Z-Score divergence, the SPY to broad market differential is slowly closing. We would like to see a much smaller divergence before issuing an “all clear” in terms of market breadth. This can either be achieved by SPY correcting more than the rest of the market, or the market catching up to SPY’s performance. So far, we’ve seen evidence of the former.
Bearish Signal in Market Internals Z-Score

Good news for the bulls - despite the pullback, Dollar Transaction Volume has remained subdued. This signals that prevailing prices don’t attract buyers or sellers here. And it’s the sellers that could be a problem in a drawdown situation.
Lower volume on lower prices is bullish.
Bullish signal in Average Dollar Transaction Volume and Volatility

5. Trading in the Sigma Portfolio
After reviewing all of the above factors, it’s time to decide on the actual investing strategy for our real-life portfolio.
As we noticed at the beginning of the article, our automated strategies have thrown caution to the wind and are buying the dip. This implies they are also betting on a Dollar pullback. Going to 127% average exposure in a fearful market is telling.
Automated Strategies

The Sigma Portfolio (Live)

In The Sigma Portfolio, we have also deployed dry powder yesterday. We’re still holding back to a certain extent, as NVDA’s earnings later today could torpedo part of our performance. For reference, here’s a statistic on their ER and next day’s stock movements.

There are also other signs the correction is not yet complete and more downside could be registered. We plan to increase exposure again after getting a bit more confirmation of the “reflexive rally” dinamic.
Using our Portfolio Tracker, we can determine our exact Sector / Factor exposure for the equities part of the allocation as seen below.
We’ve left last week’s Sector correlation up, so you can see how the rebalance affected our exposure.
Last week:

Now:

We’ve reduced Industrials (XLI), Utilities (XLU) and Tech (XLK) exposure in favor of Tech (XLK), Communications (XLC) and Consumer Discretionary (XLY). Overall, the portfolio is better balanced.
In terms of Factors, our trades have balanced out exposure as well.
You can access this correlation distribution for your portfolio as well by setting up the Portfolio Tracker.
Last week:

Today:
